Edge Device Statistics
You can monitor the Edge Device statistics from the Edge Device UI by clicking Statistics in the navigation menu.
The Statistics screen is displayed as below for example:
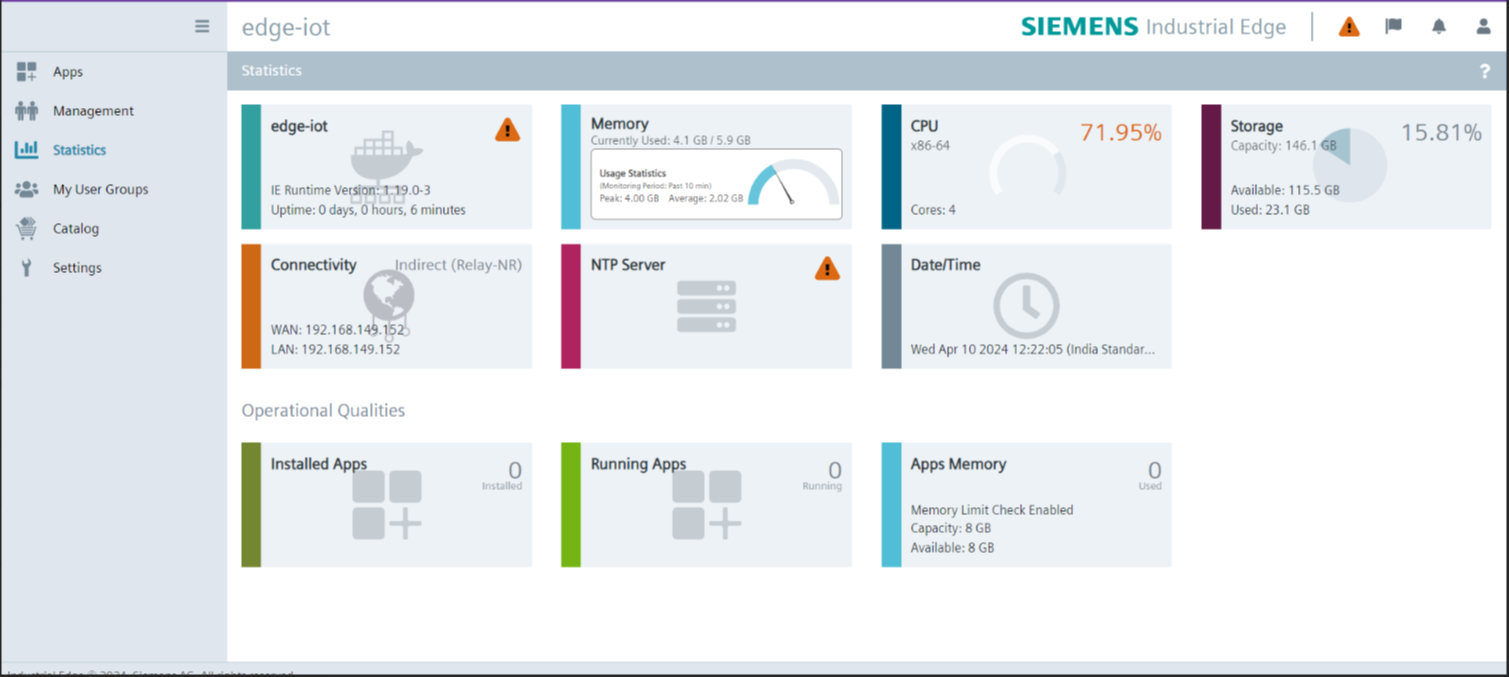
The GetResourceStats RPC method of the system service returns current CPU, Memory, Uptime and Storage information.
Below you can find an example on how to calculate Storage and Memory statistics.
Storage Statistics
Storage statistics can be gathered from the Edge Device with the df command:
$-> df -h
Filesystem      Size  Used Avail Use% Mounted on
/dev/sda1        19G  8,5G  9,6G  47% /
Mapping of these values to the Edge Device UI is displayed below:
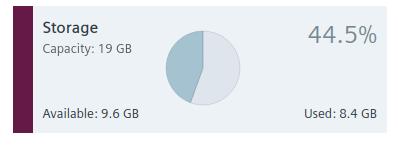
- Capacity : Total storage available
- Available : Available free storage
- Used : Used storage by the Edge Device
- Percentage: Percentage of used space
Percentage can be calculated like this:
Percentage = (Used * 100) / Capacity
Memory Statistics
Memory statistics can be gathered from the Edge Device with the top command:
$-> top
top - 12:10:11 up 1 day,  8:36,  1 user,  load average: 0,18, 0,29, 0,25
Tasks: 225 total,   1 running, 224 sleeping,   0 stopped,   0 zombie
%Cpu(s):  1,7 us,  0,3 sy,  0,0 ni, 97,9 id,  0,0 wa,  0,0 hi,  0,0 si,  0,0 st
GiB Mem :     13,1 total,      7,9 free,      2,0 used,      3,1 buff/cache
GiB Swap:      0,9 total,      0,9 free,      0,0 used.     10,7 avail Mem
Mapping of these values to the Edge Device UI is displayed below:
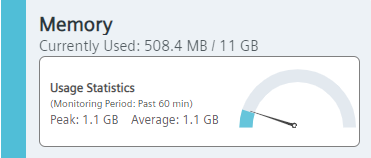
- Capacity : Total memory available
- Used : Used memory by the Edge Device
- Peak : Maximum memory used in the selected Monitoring Period
- Average : Average memory used in the selected Monitoring Period
Percentage can be calculated like this:
Percentage = (Used * 100) / Capacity
Funding Acknowledgment: Funded by the Federal Ministry for Economic Affairs and Energy based on a decision by the German Bundestag | Your funding provider: Kicks for Edge as part of the EU funding program IPCEI-CIS (FKZ:13IPC008)