Streaming logs
You can configure device metrics and log data on the Edge Management device settings page or directly access the specific device UI for stream based logging. The configuration changes will be automatically synchronized between your Industrial Edge Management and the Edge Device.
NOTICE
It can take up to 30 seconds to sync the configuration updates.
Disable streaming logs
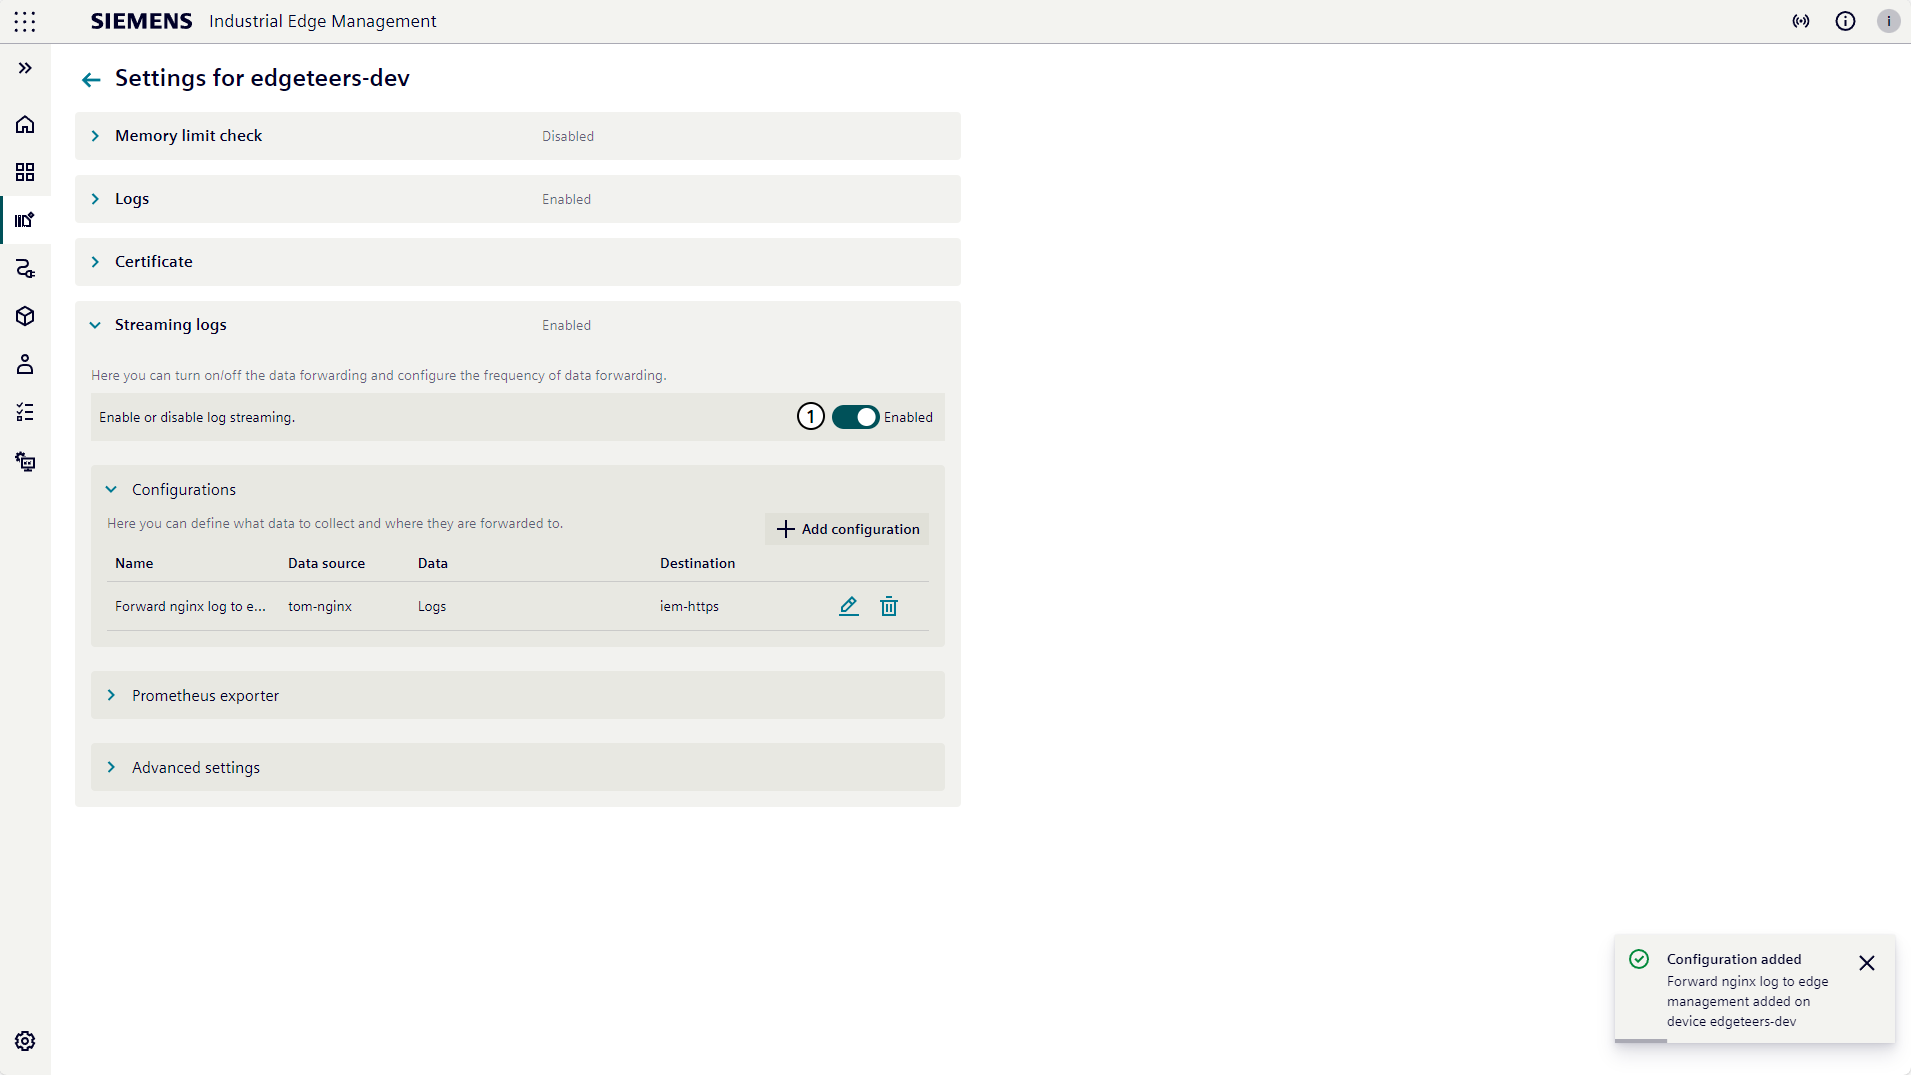
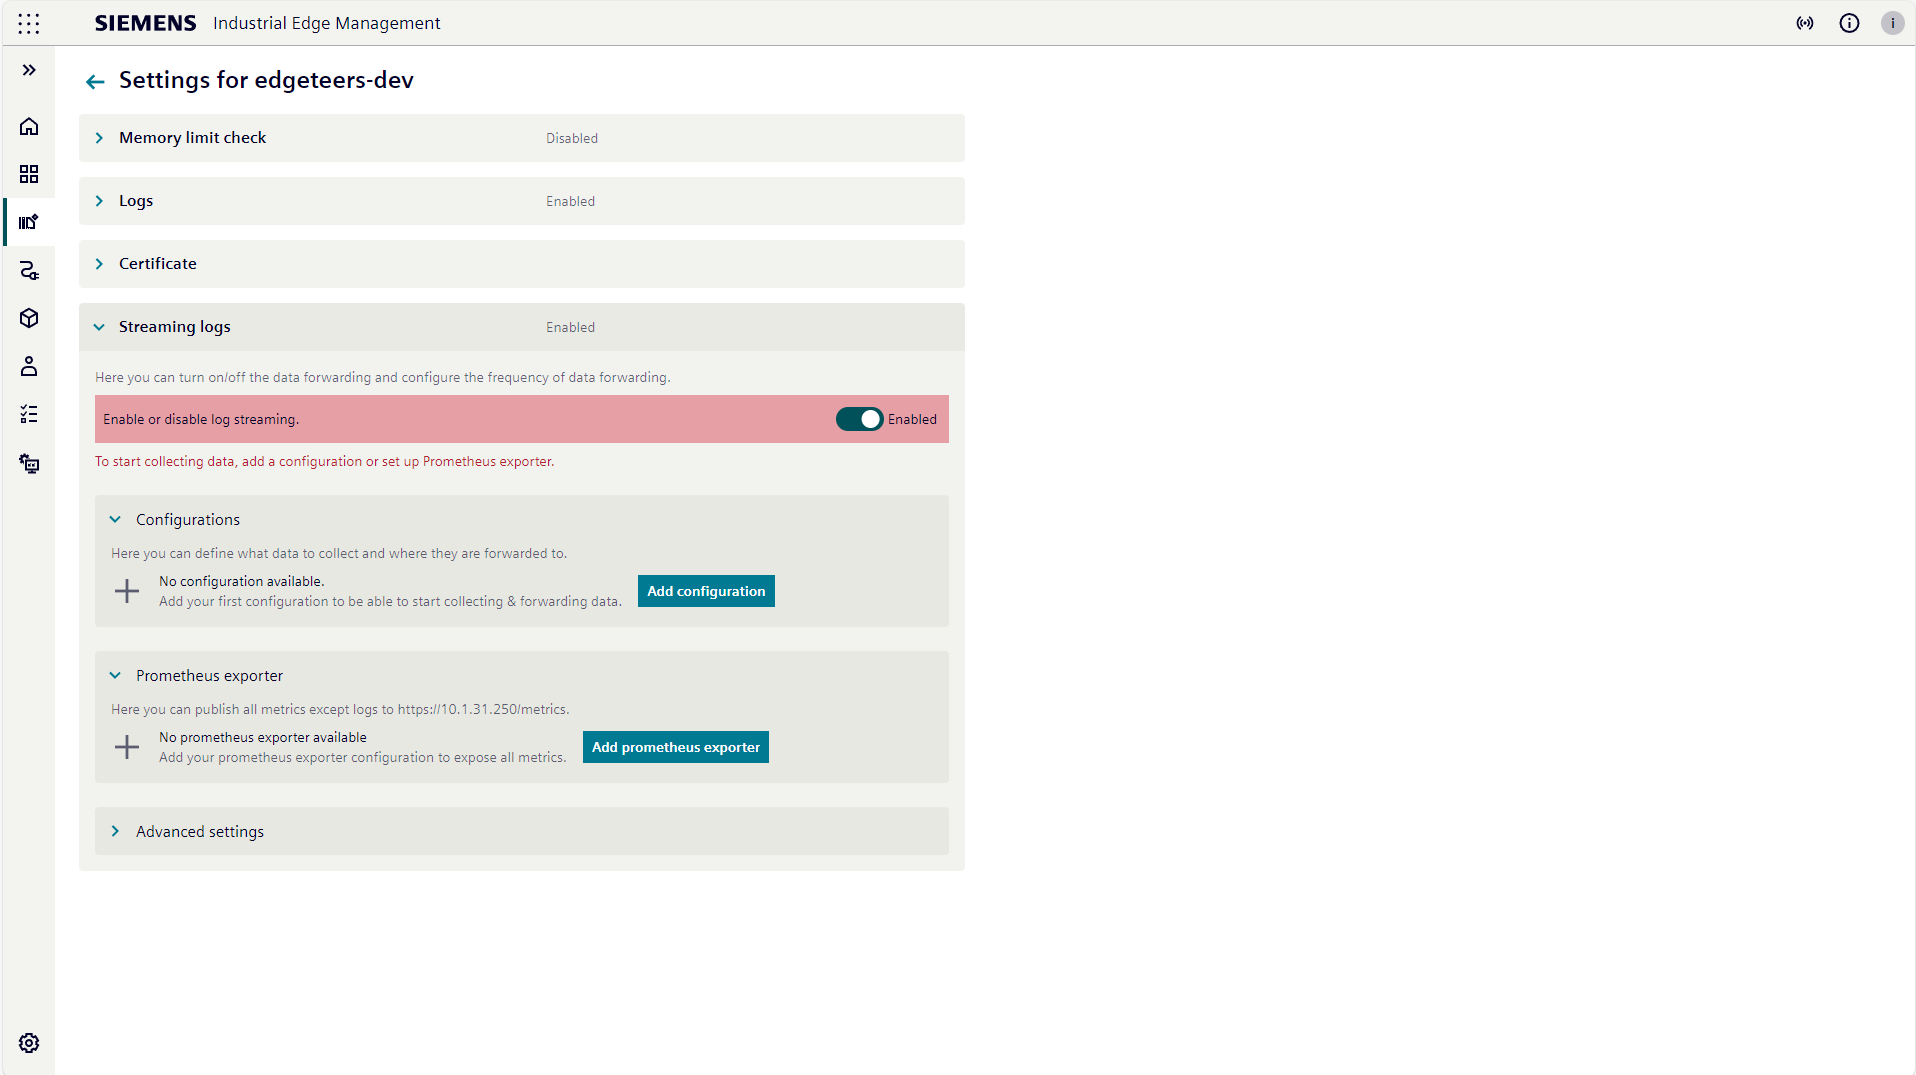
The streaming logs is enabled by default. To disabled it click the service toggler(①).
Configurations
When streaming logs is enabled but without any configuration or prometheus exporter created, area ① turns red.
To collect device's metrics and log data, you can create a configuration to specify what data to collect and where they are forwarded to.
Create your first configuration
Click Add configuration to navigate to the new configuration page.
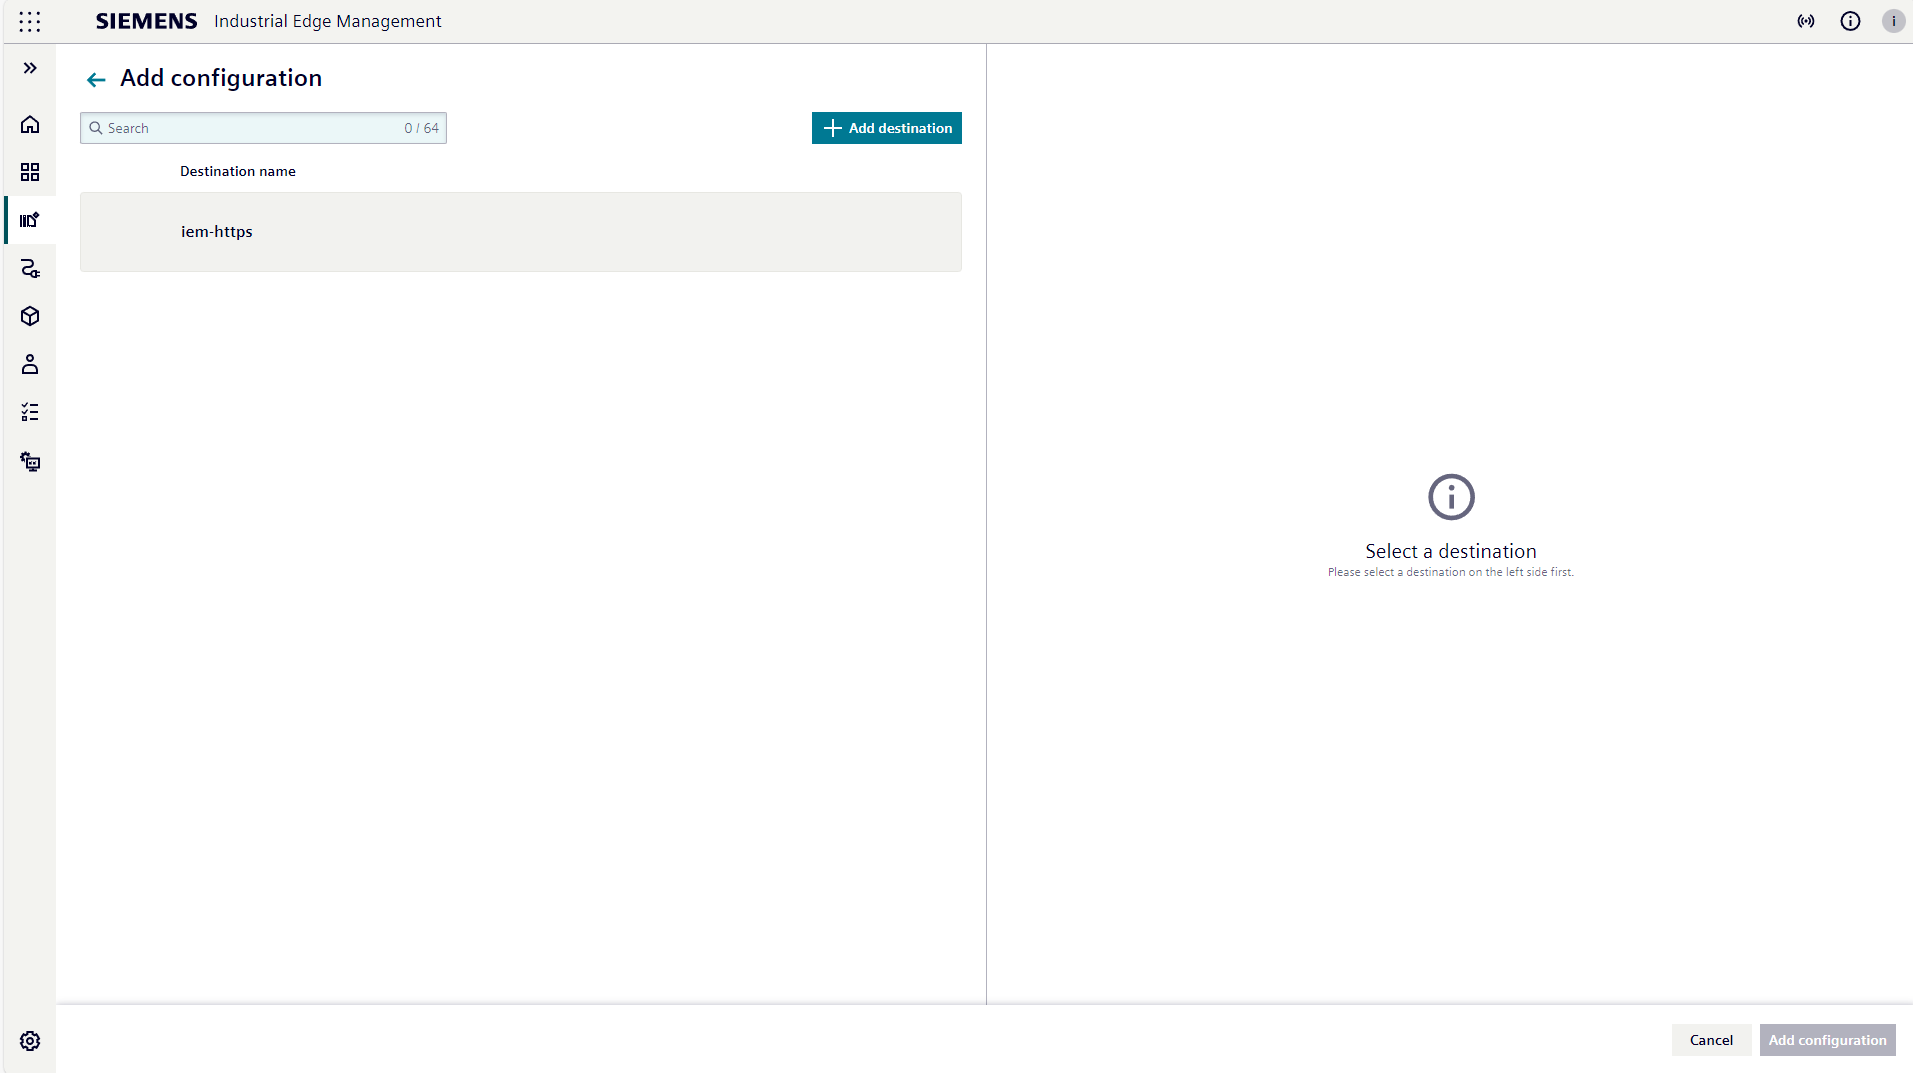
Select a destination to receive the collected data. Once a destination is selected, a form will appear on the right.
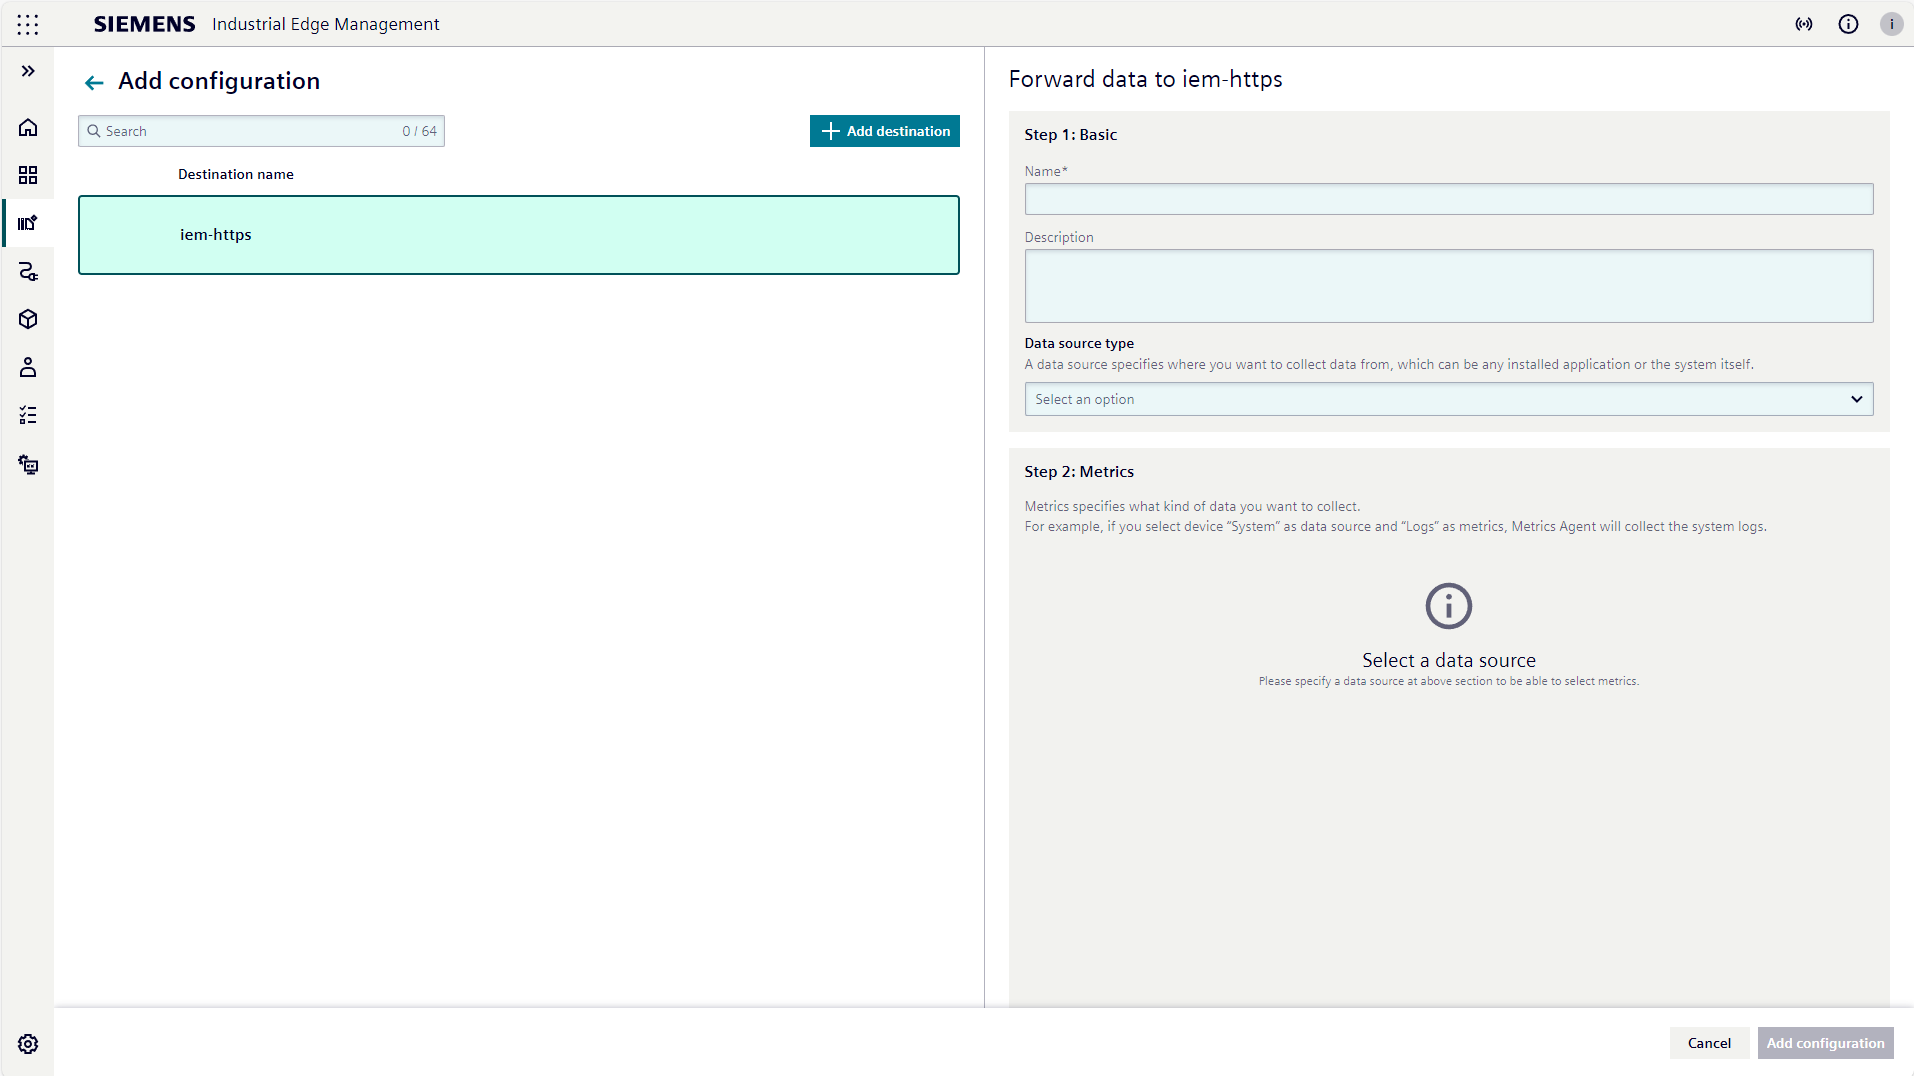
Fill in the configuration title and description. Select the metrics that specify the type of data to be collected. For more details about metrics, please refer to Metrics Types.

Click Add configuration will navigate you to the device settings page, and a newly created configuration is shown.
And area ① turns to normal.
Destinations
Destination is an endpoint to receive collected metrics and logs data from devices. It could be a postgres server, an influx database or a cloud monitoring service like datadog and so on.
NOTICE
The pre-defined destination iem-https, which connected the Logging & Monitoring of the IE Device service to the IEM Logging & Monitoring service, is no longer supported. Please switch to using an external system to consume data.
Define your own destination
Click Add destination.
A destination form is shown as below.
There are serval types of destination available.
Here we take HTTP as an example.
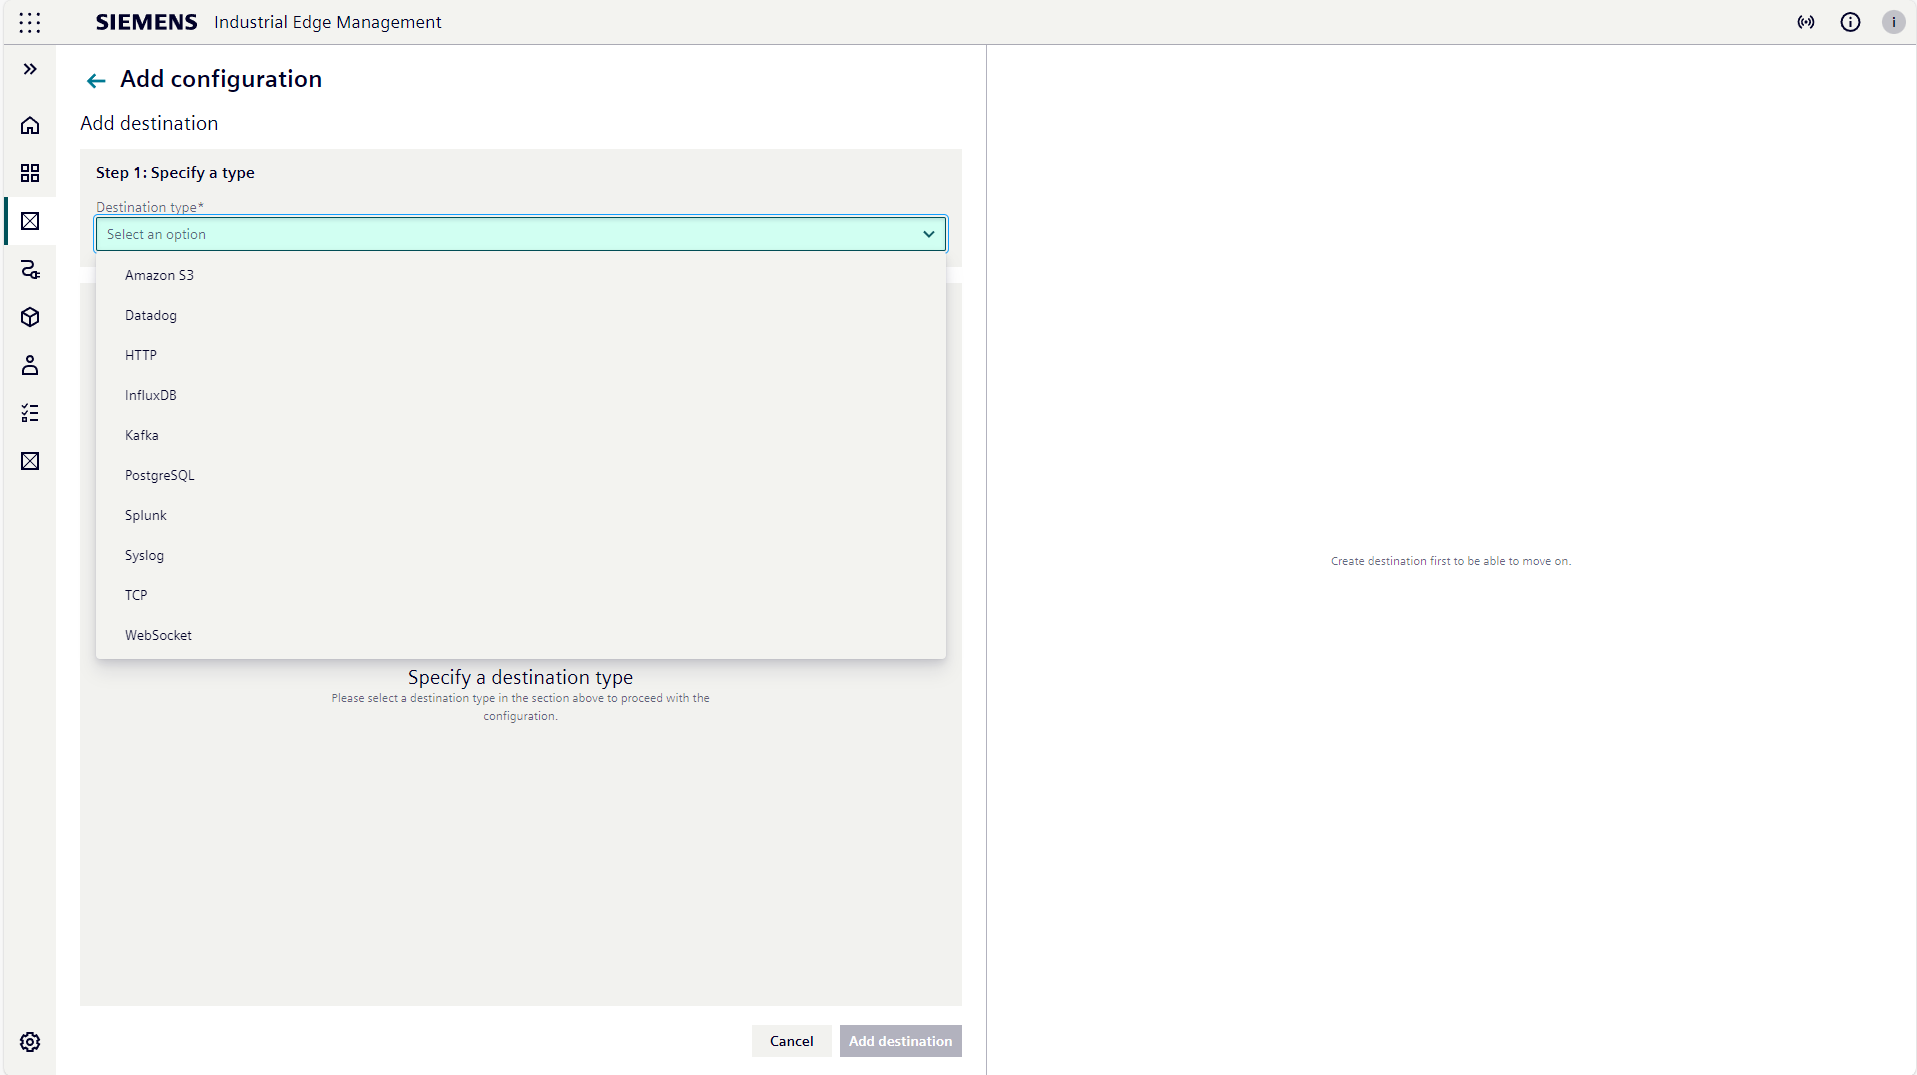
By selecting HTTP, a more detailed destination form will be displayed.
Fill out the required fields, and the Add destination button will become enabled.
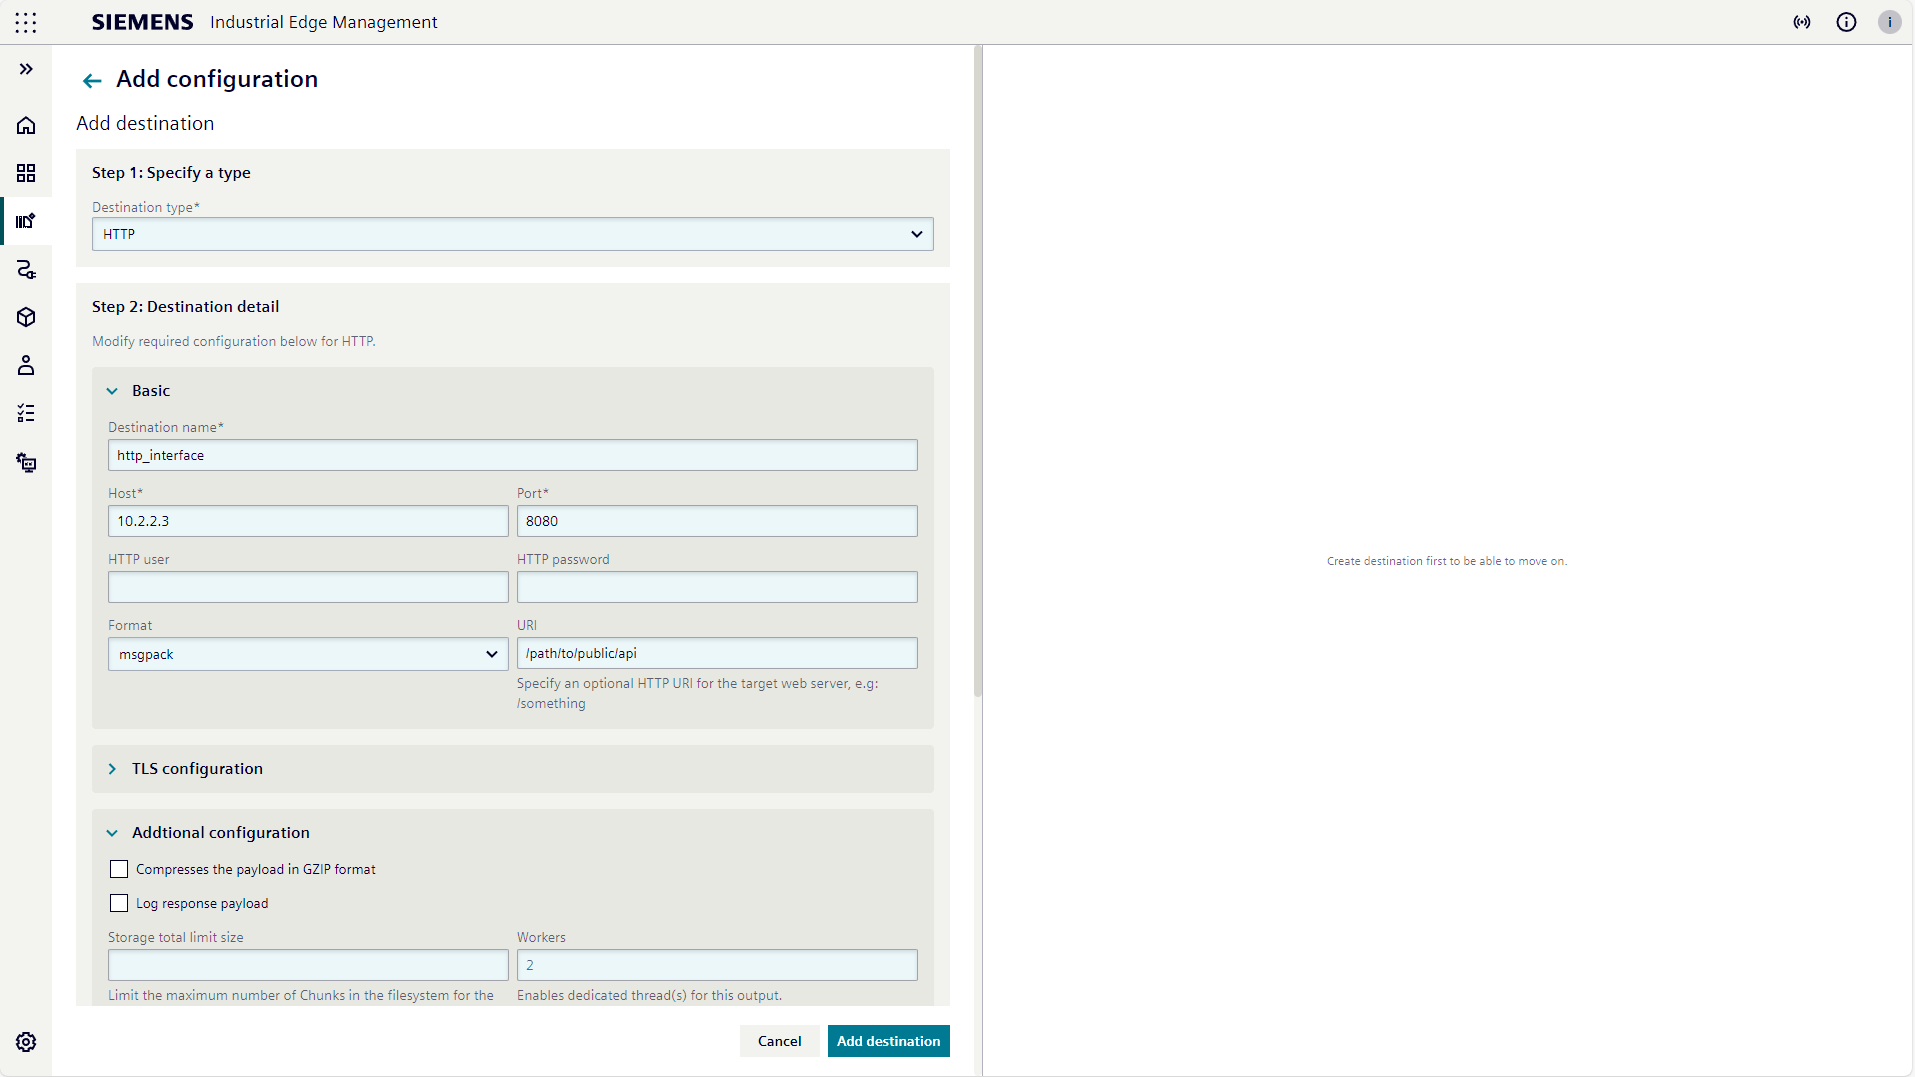
Click the Add destination button at the bottom.
The newly created destination will appear in the list and be automatically selected.
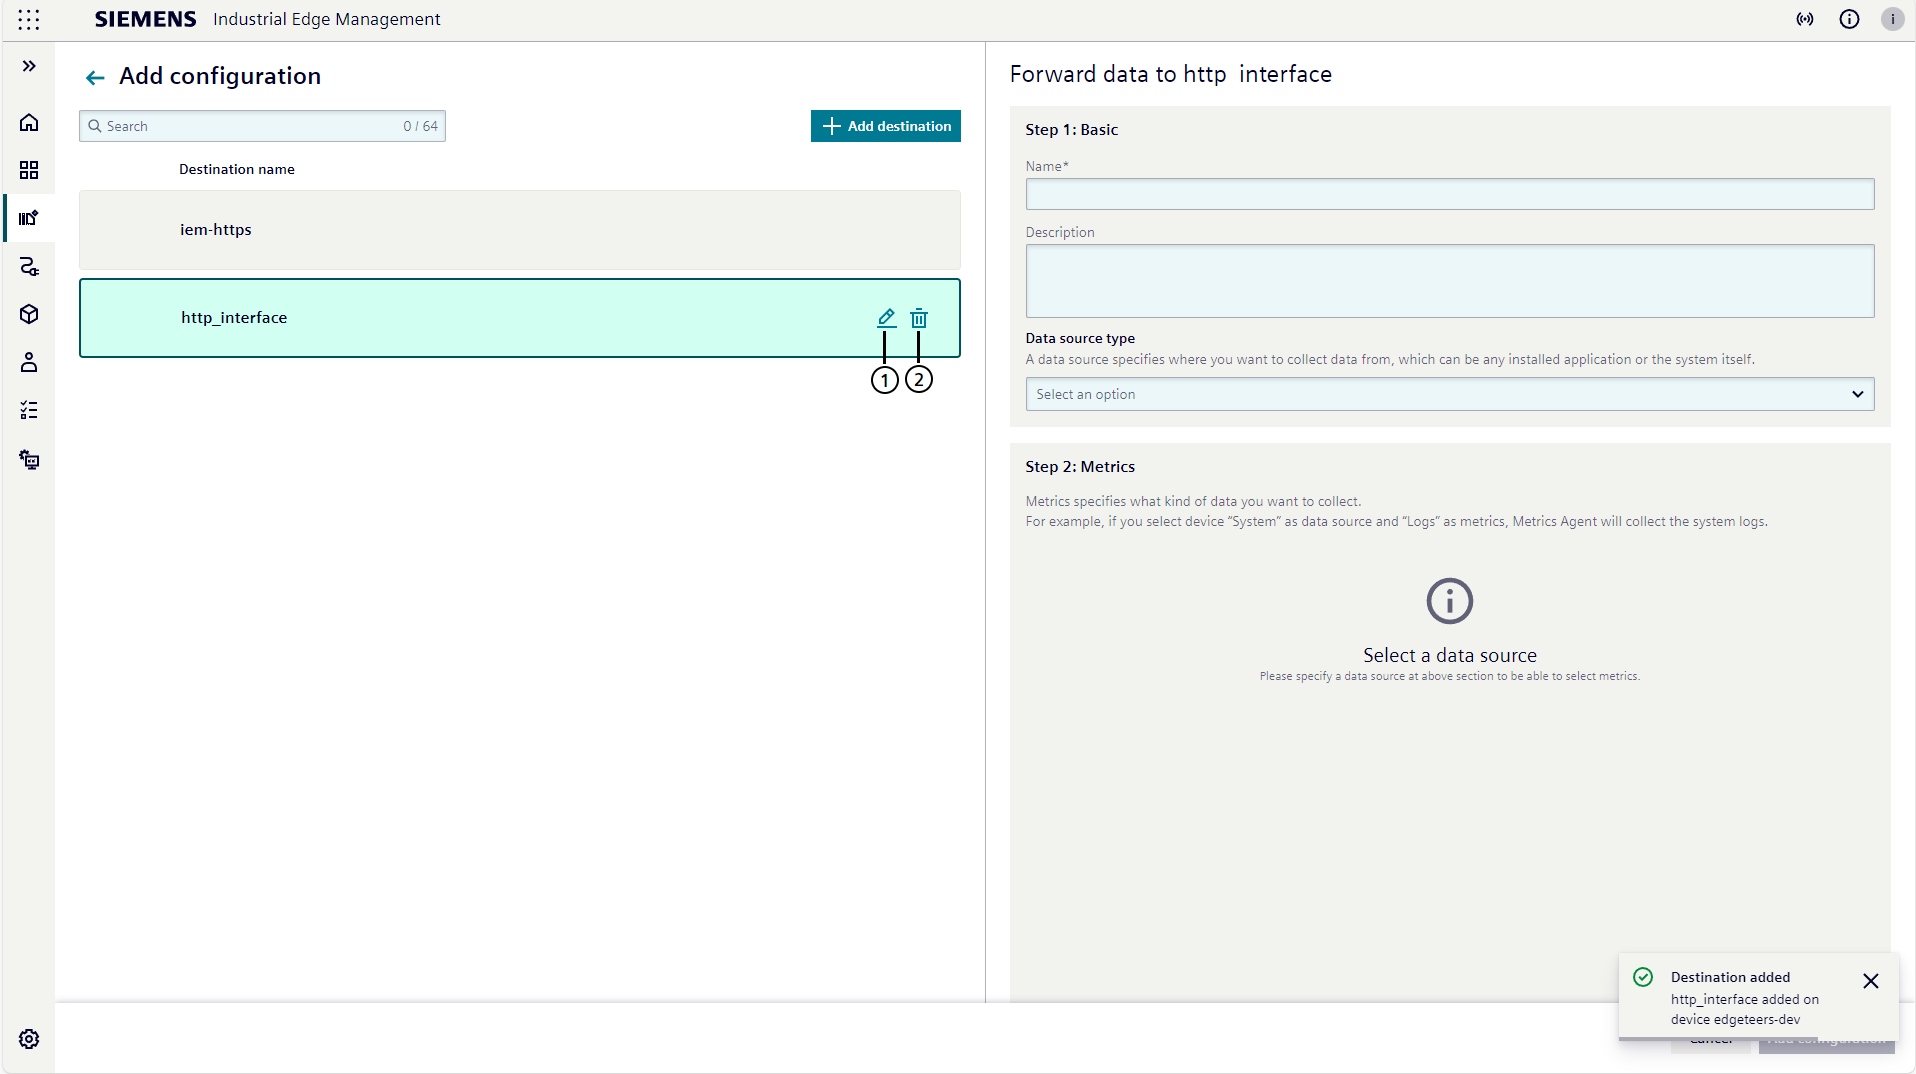
To edit the destination, just click the edit icon button at area ①. It is similar with adding a destination, just with value pre-filled.
To remove a destination, just click the trash can button at area ②.
Prometheus exporter
By configuring Prometheus exporter, you can publish the collected data from devices to specific endpoint https://<device-ip>/metrics.
If you use Prometheus, you are able to actively pull data from the endpoint.
Since Prometheus servers require credentials to access https://<device-ip>/metrics, you must configure a username and password to enable the Prometheus exporter.
NOTICE
Currently, only basic authentication mechanism is supported.
Configure prometheus exporter
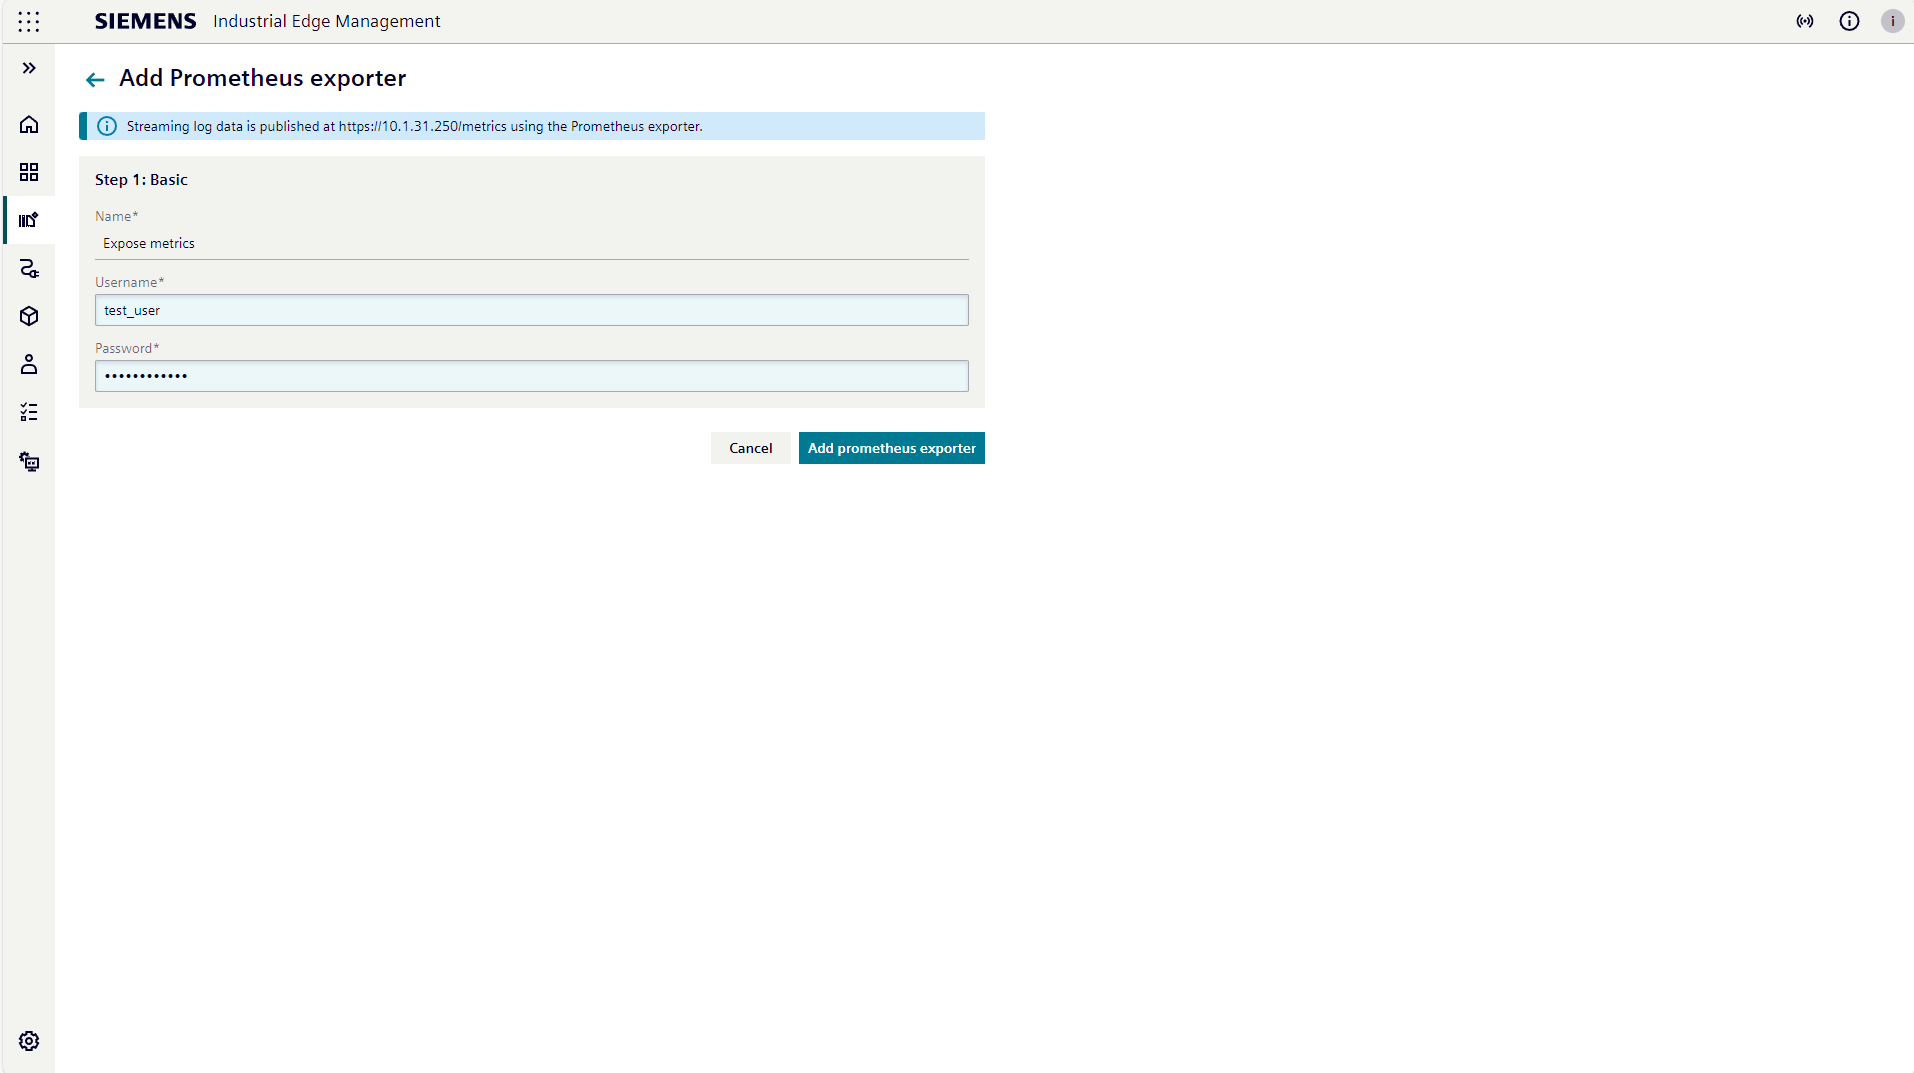
Click Add prometheus exporter will navigate to prometheus exporter configuration page.
Fill in the username and password fields, then click Add prometheus exporter.
The settings page will display information about the configured Prometheus exporter once it is set up.
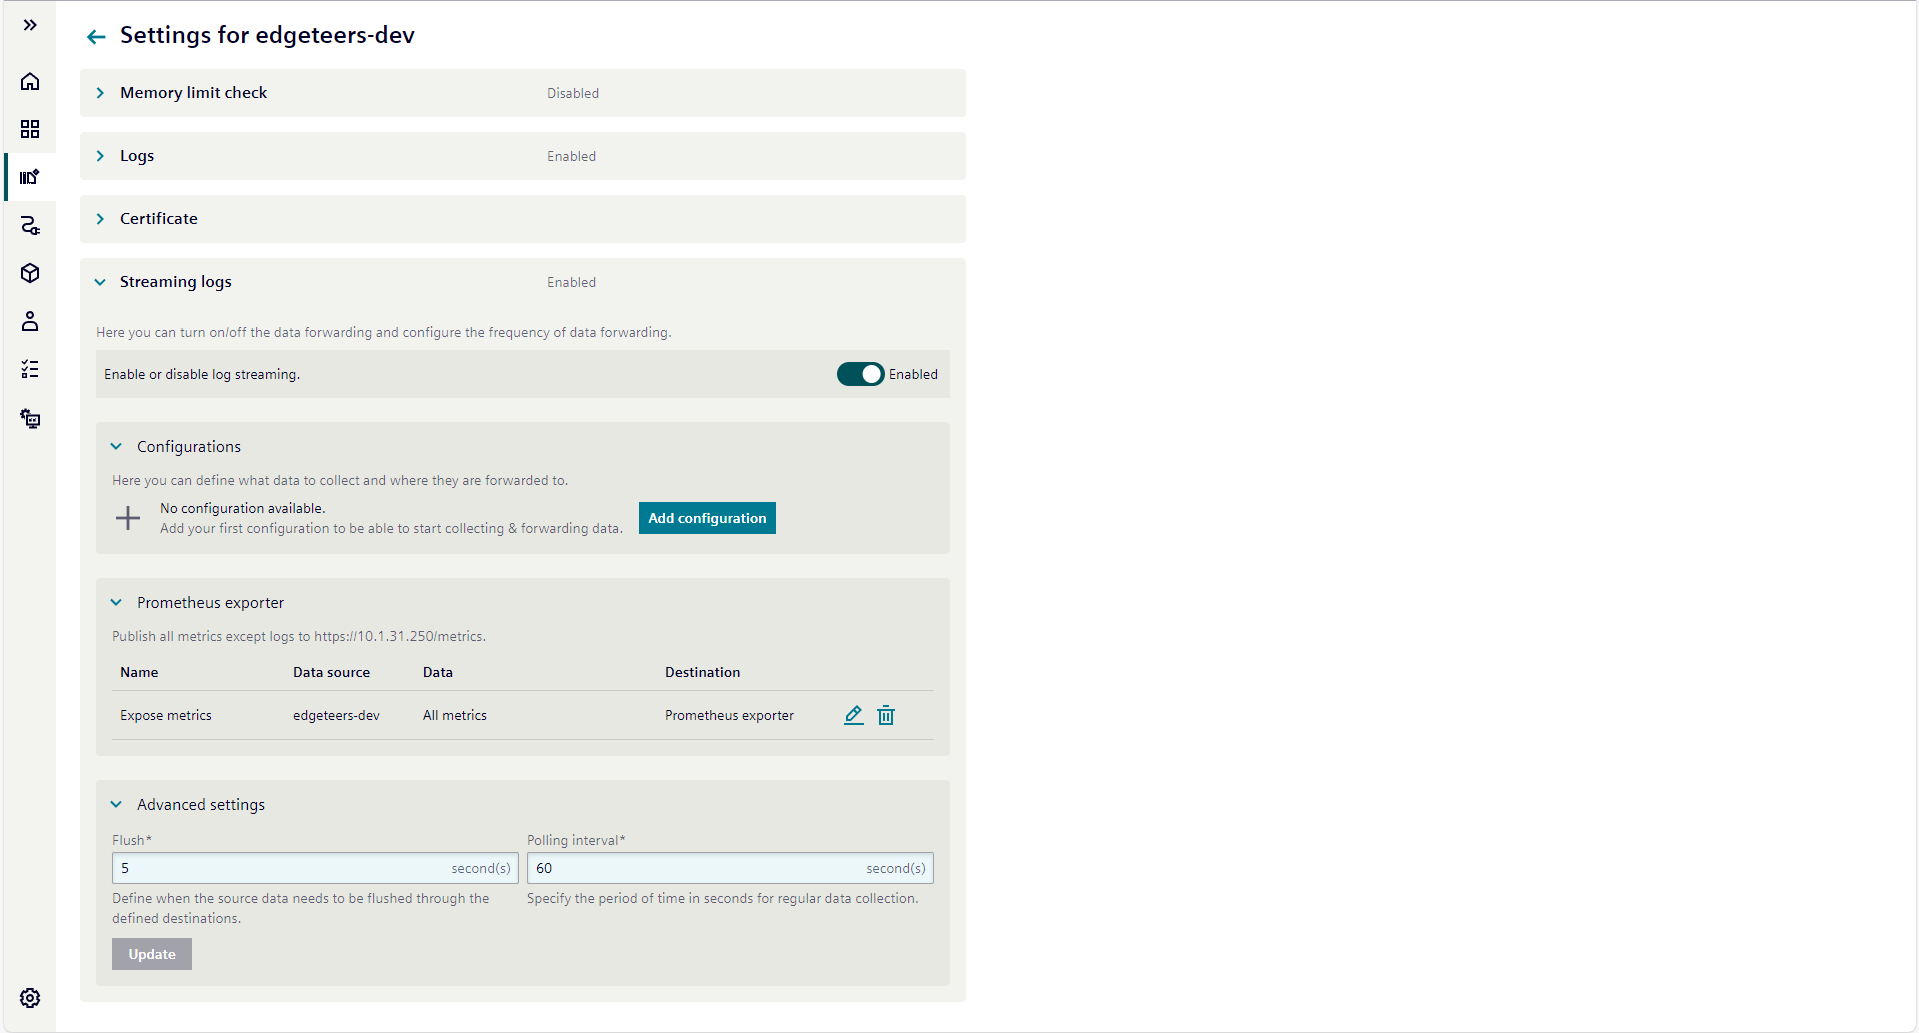
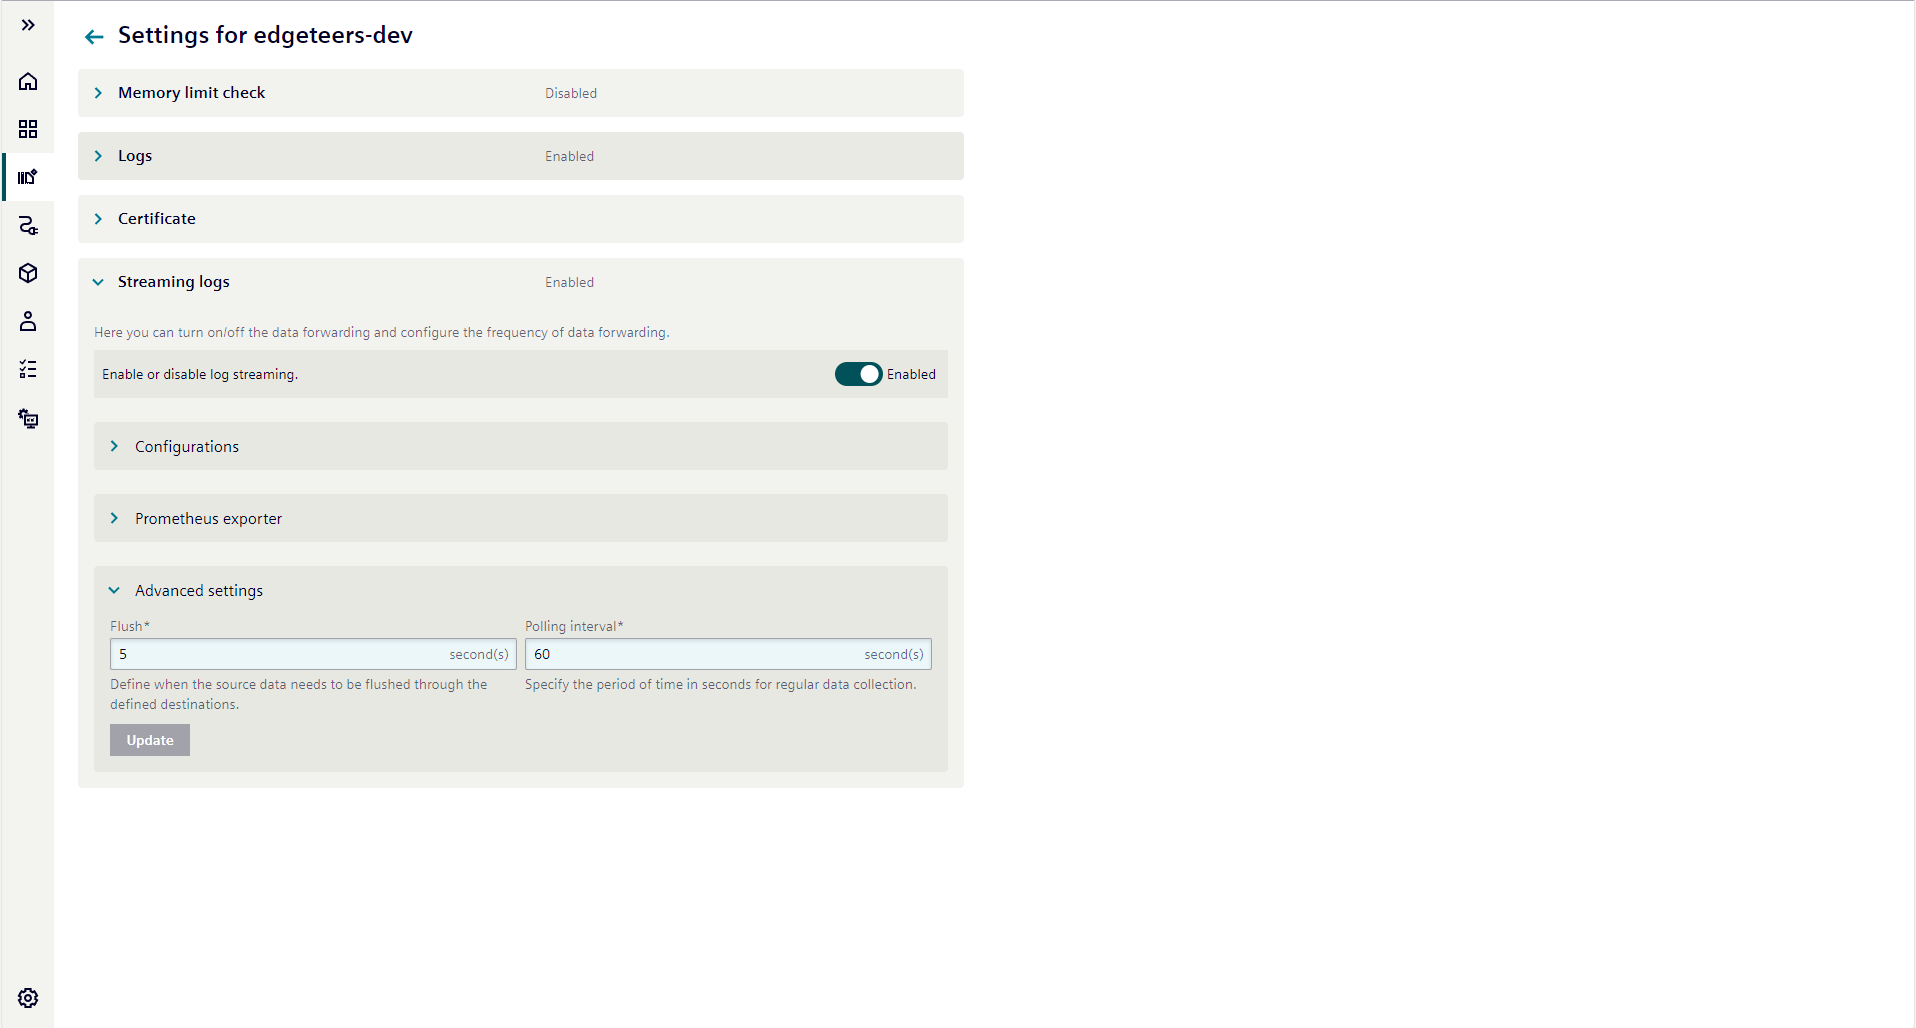
Advanced settings
With the introduction of the Advanced configuration mode for the "Logging and Monitoring" service on Industrial Edge Devices for IEDK 1.29, it is possible to have direct control over metrics collection and routing, enabling configuration of what device metrics are collected and sent to onitoring infrastructures. This Fluent Bit configuration can currently only be accessed and edited via the text editor on the Industrial Edge Devices WebUI.
| Parameter | Description |
|---|---|
| Flush |
|
| Polling interval |
|
Limitation
- To support device's streaming logs settings on Industrial Edge Management, the device version should be higher than version 1.22.0-7. A notification will show up if the device does not support and all streaming logs related settings will be disabled on Industrial Edge Management.

- Due to data transmission limitations, streaming logs settings (including user configurations, TLS certificates, etc.) should be below 30KB.