Logging & Monitoring
The Logging & Monitoring service in Industrial Edge enables users to configure monitoring mechanisms around their Industrial Edge infrastructure.
If you are looking for guidance on how to implement monitoring effectively, please refer to the Best Practices section for practical recommendations and proven approaches.
Overview
Logging & Monitoring services is available in Edge Device UI under Settings > Logging & Monitoring.
Logging & Monitoring Service is displayed as below:
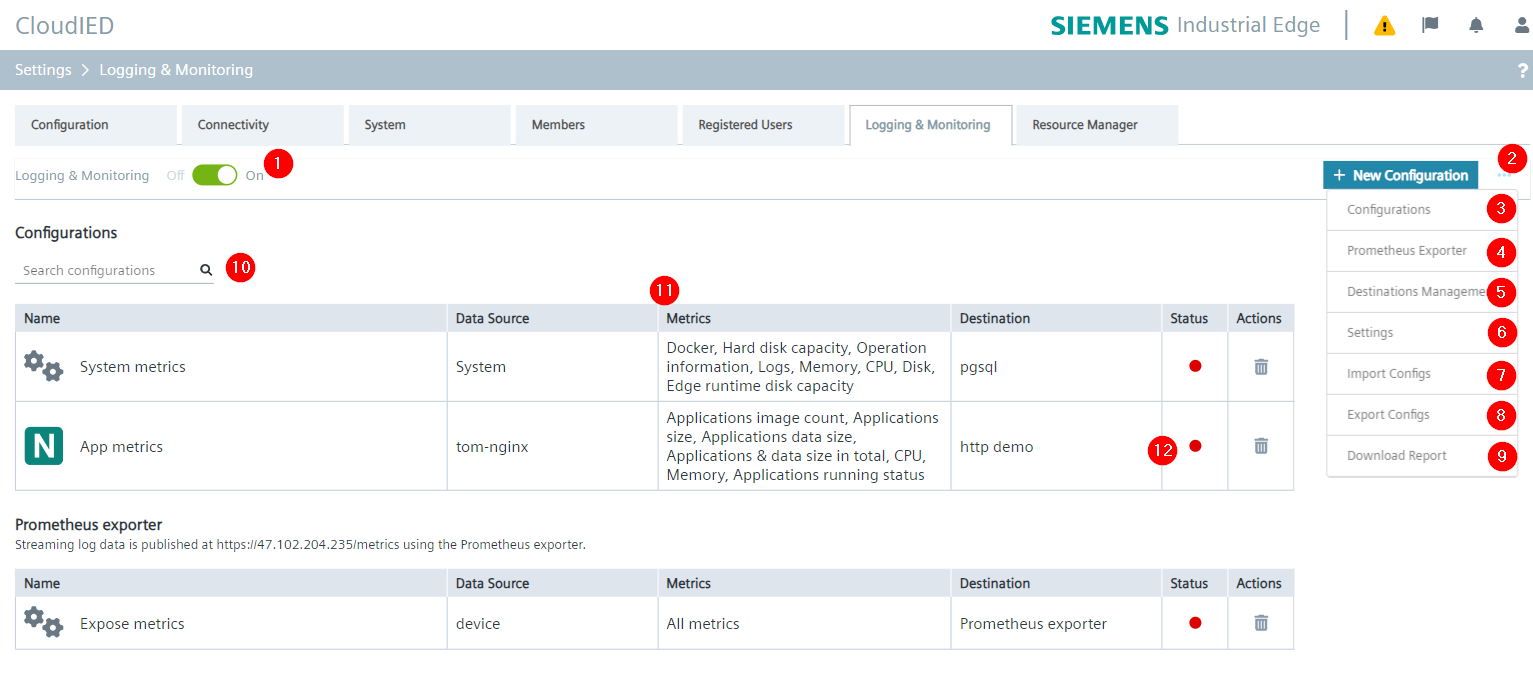
| No. | Items |
|---|---|
| ① | Service Toggler |
| ② | Config menu |
| ③ | Configurations: manage configurations |
| ④ | Prometheus Exporter: manage prometheus exporter |
| ⑤ | Destinations Management : manage destinations |
| ⑥ | Settings: global settings |
| ⑦ | Import Configs: import, upload configuration file |
| ⑧ | Export Configs: download configuration as JSON file, which includes all metrics configurations. |
| ⑨ | Download Report: download IED information, for example, OS version and app versions. |
| ⑩ | Search Configurations |
| ⑪ | Configurations list: • Existing configurations and its basic information • Delete action |
| ⑫ | Destination health indicator: indicate connection status to destination |
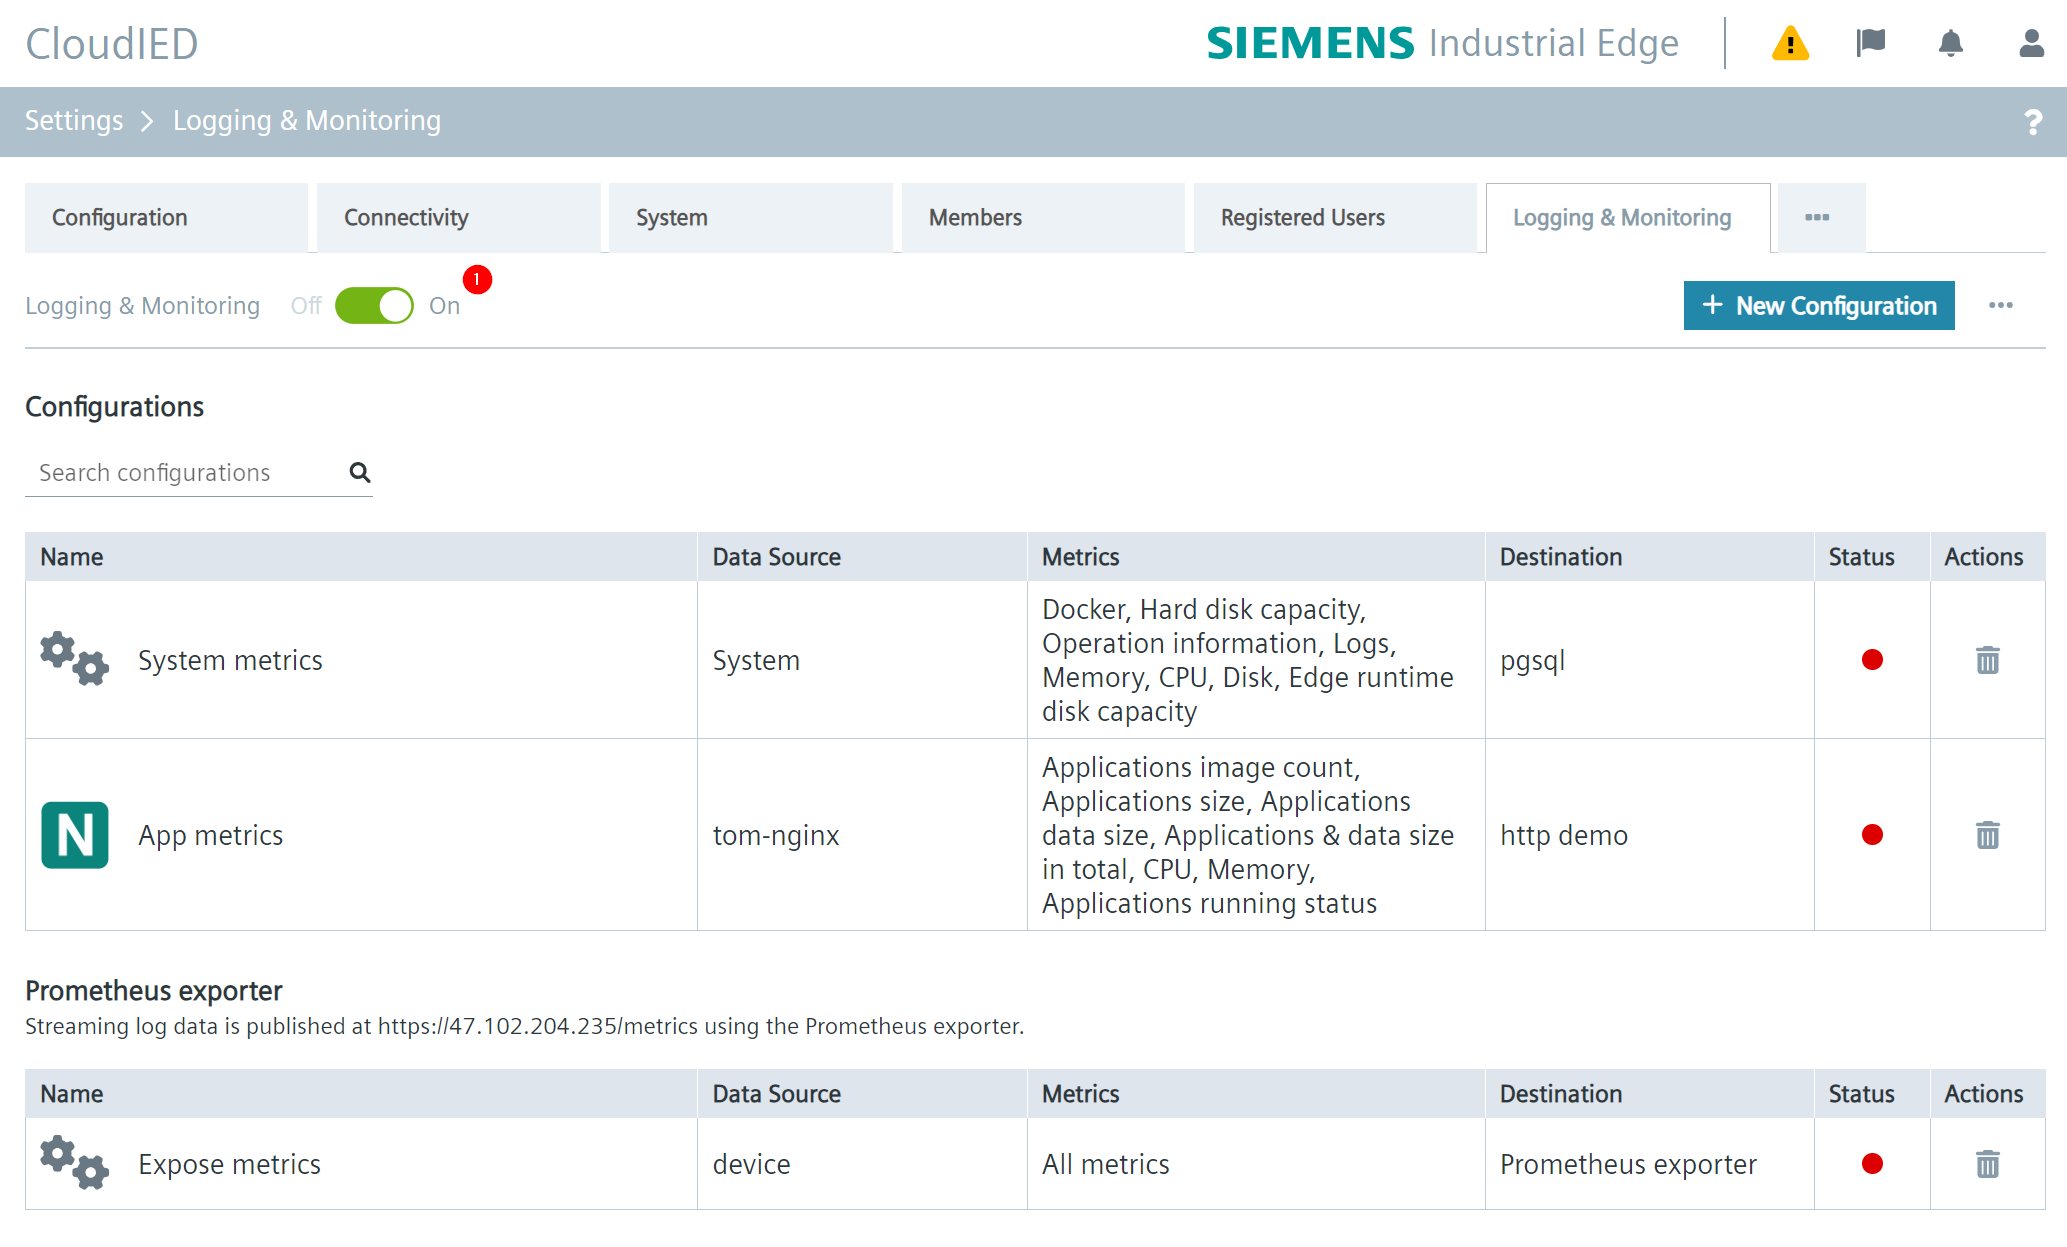
Destination health state indicator
On the area ⑪, the status is used to indicate the health status of the target.
| Available state | Description |
|---|---|
 |
The connection to destination is healthy. |
 |
Connection to destination cannot be established. |
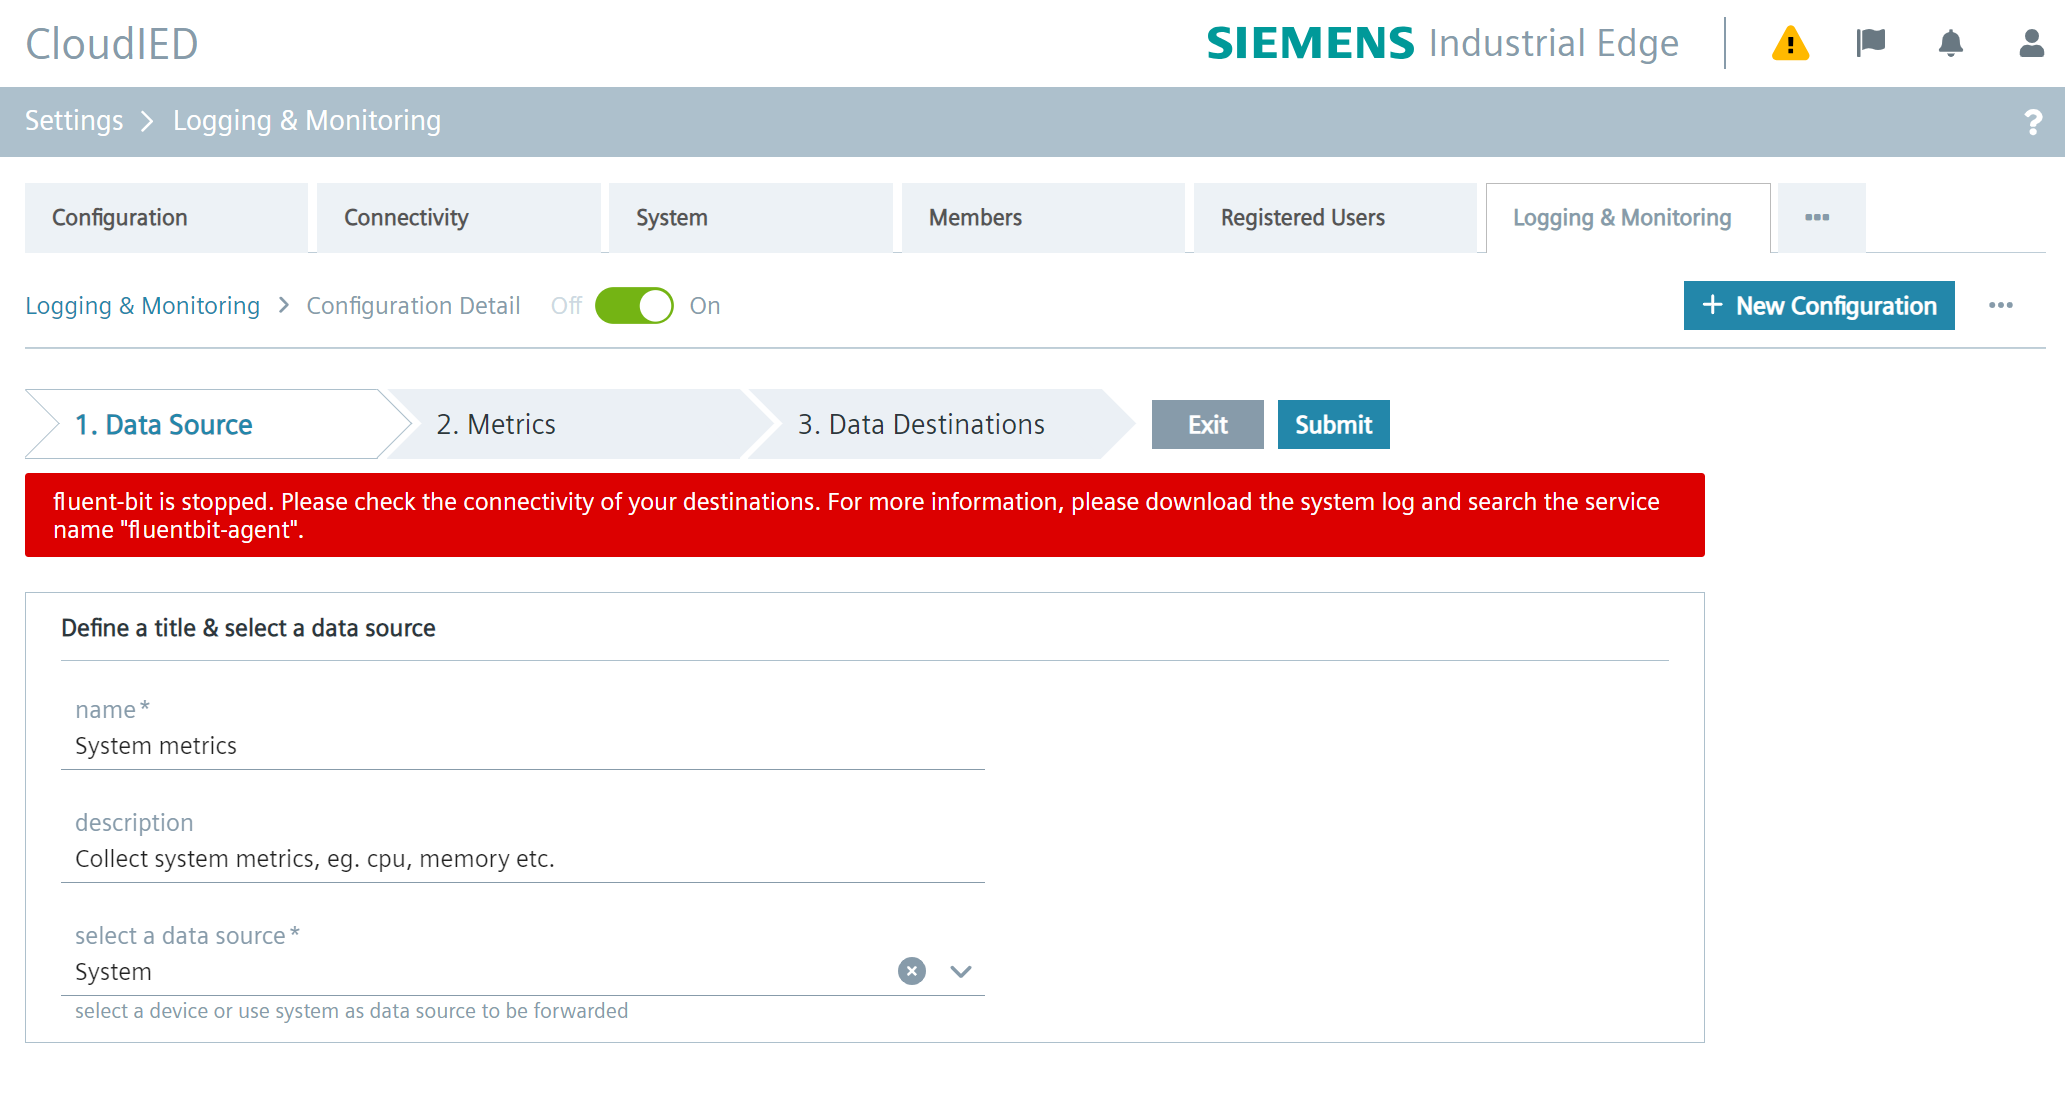
Hover over the connection error icon or go to the configuration detail page to see more details about the connection error if there is one.
The configuration detail page is displayed as below:
NOTICE
The frequency of health check depends on value of 'Settings > flush'. For example,
Disable Logging & Monitoring Service
The Logging & Monitoring Service is enabled by default. To disable it, click the service toggle at top left corner(①).
Once confirmed, the service will take approximately 30 seconds to complete.
To enable the Logging & Monitoring service again, follow the same steps as above.