Creating Configuration
Steps
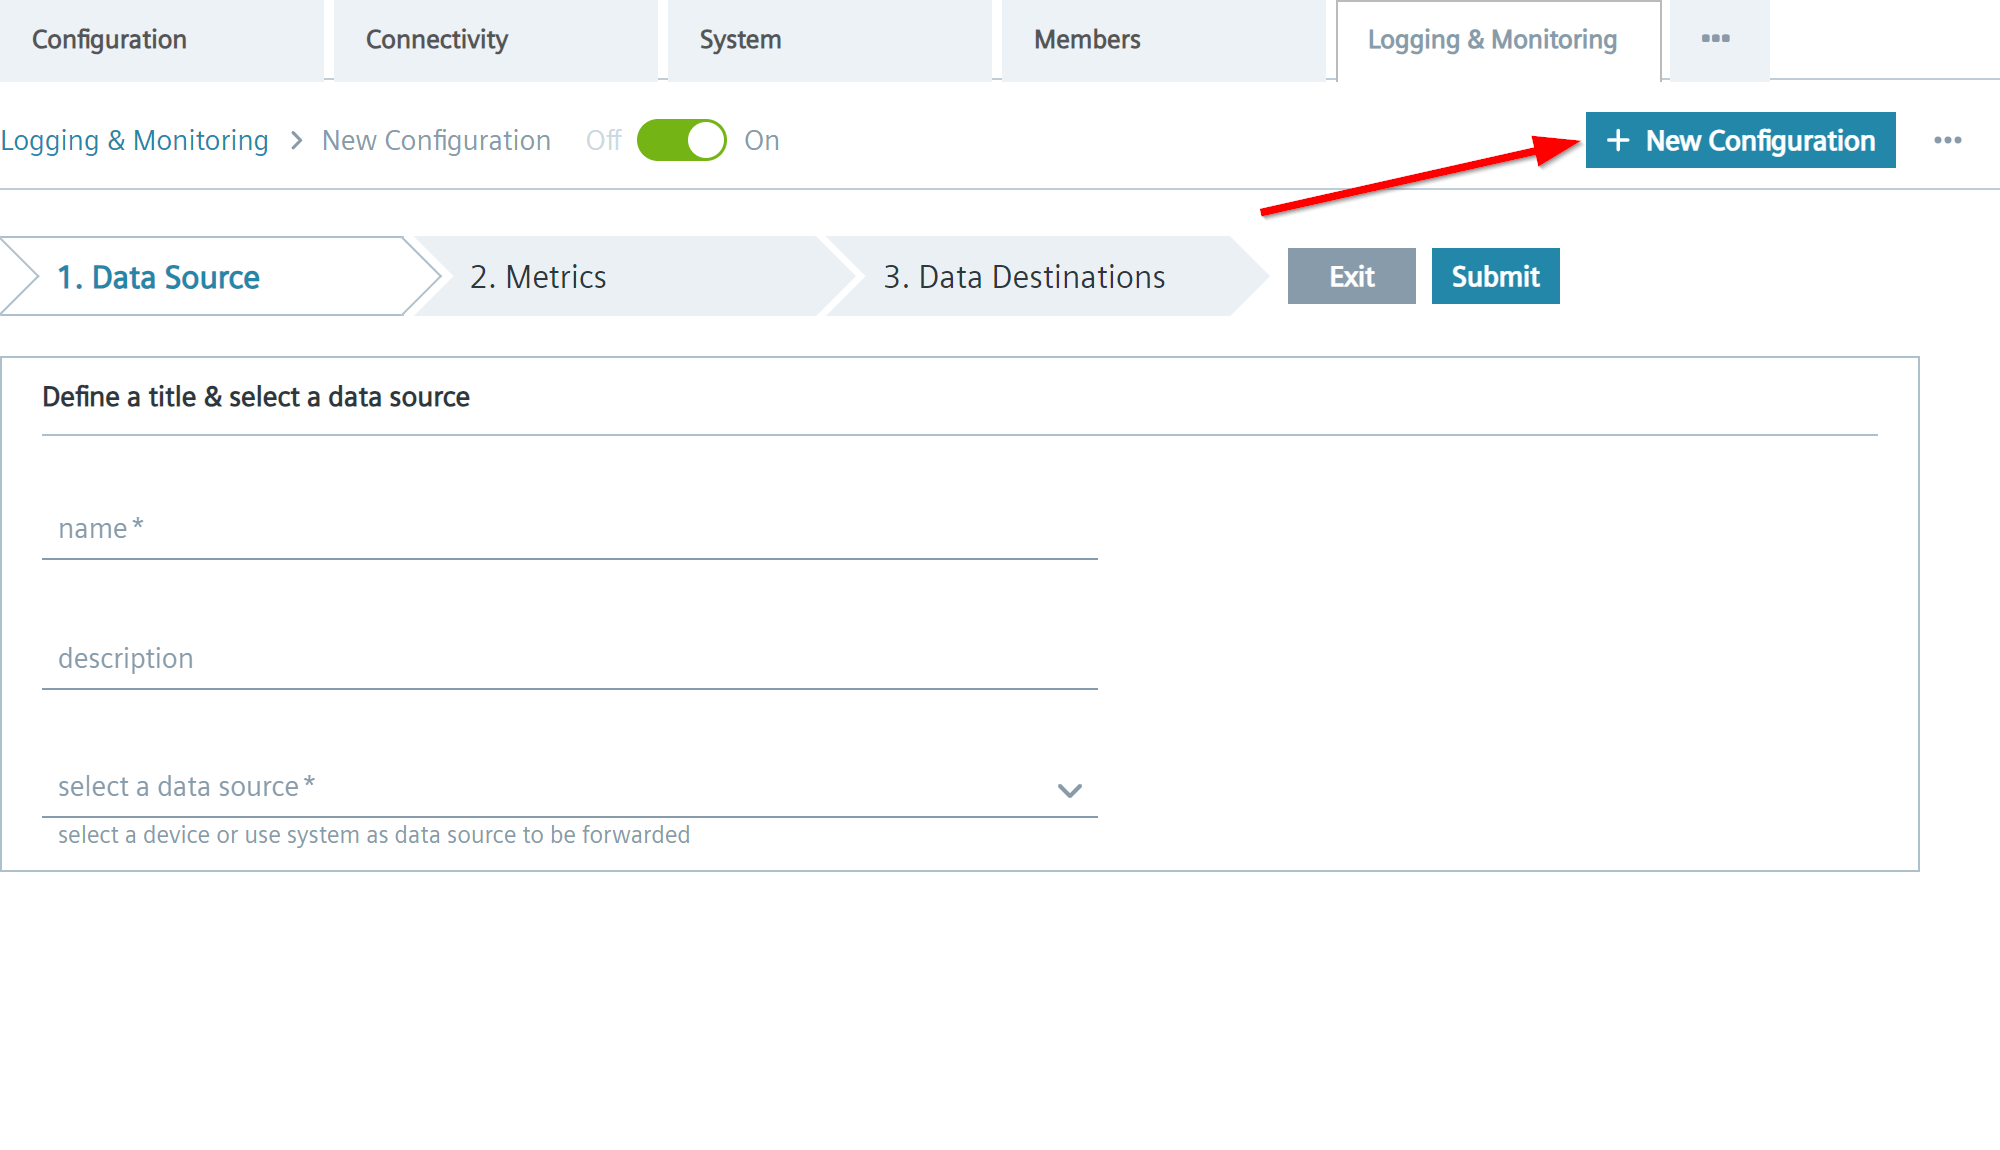
- Click
+ New Configurationbutton at the top right to create a new configuration. The configuration wizard is displayed as below.
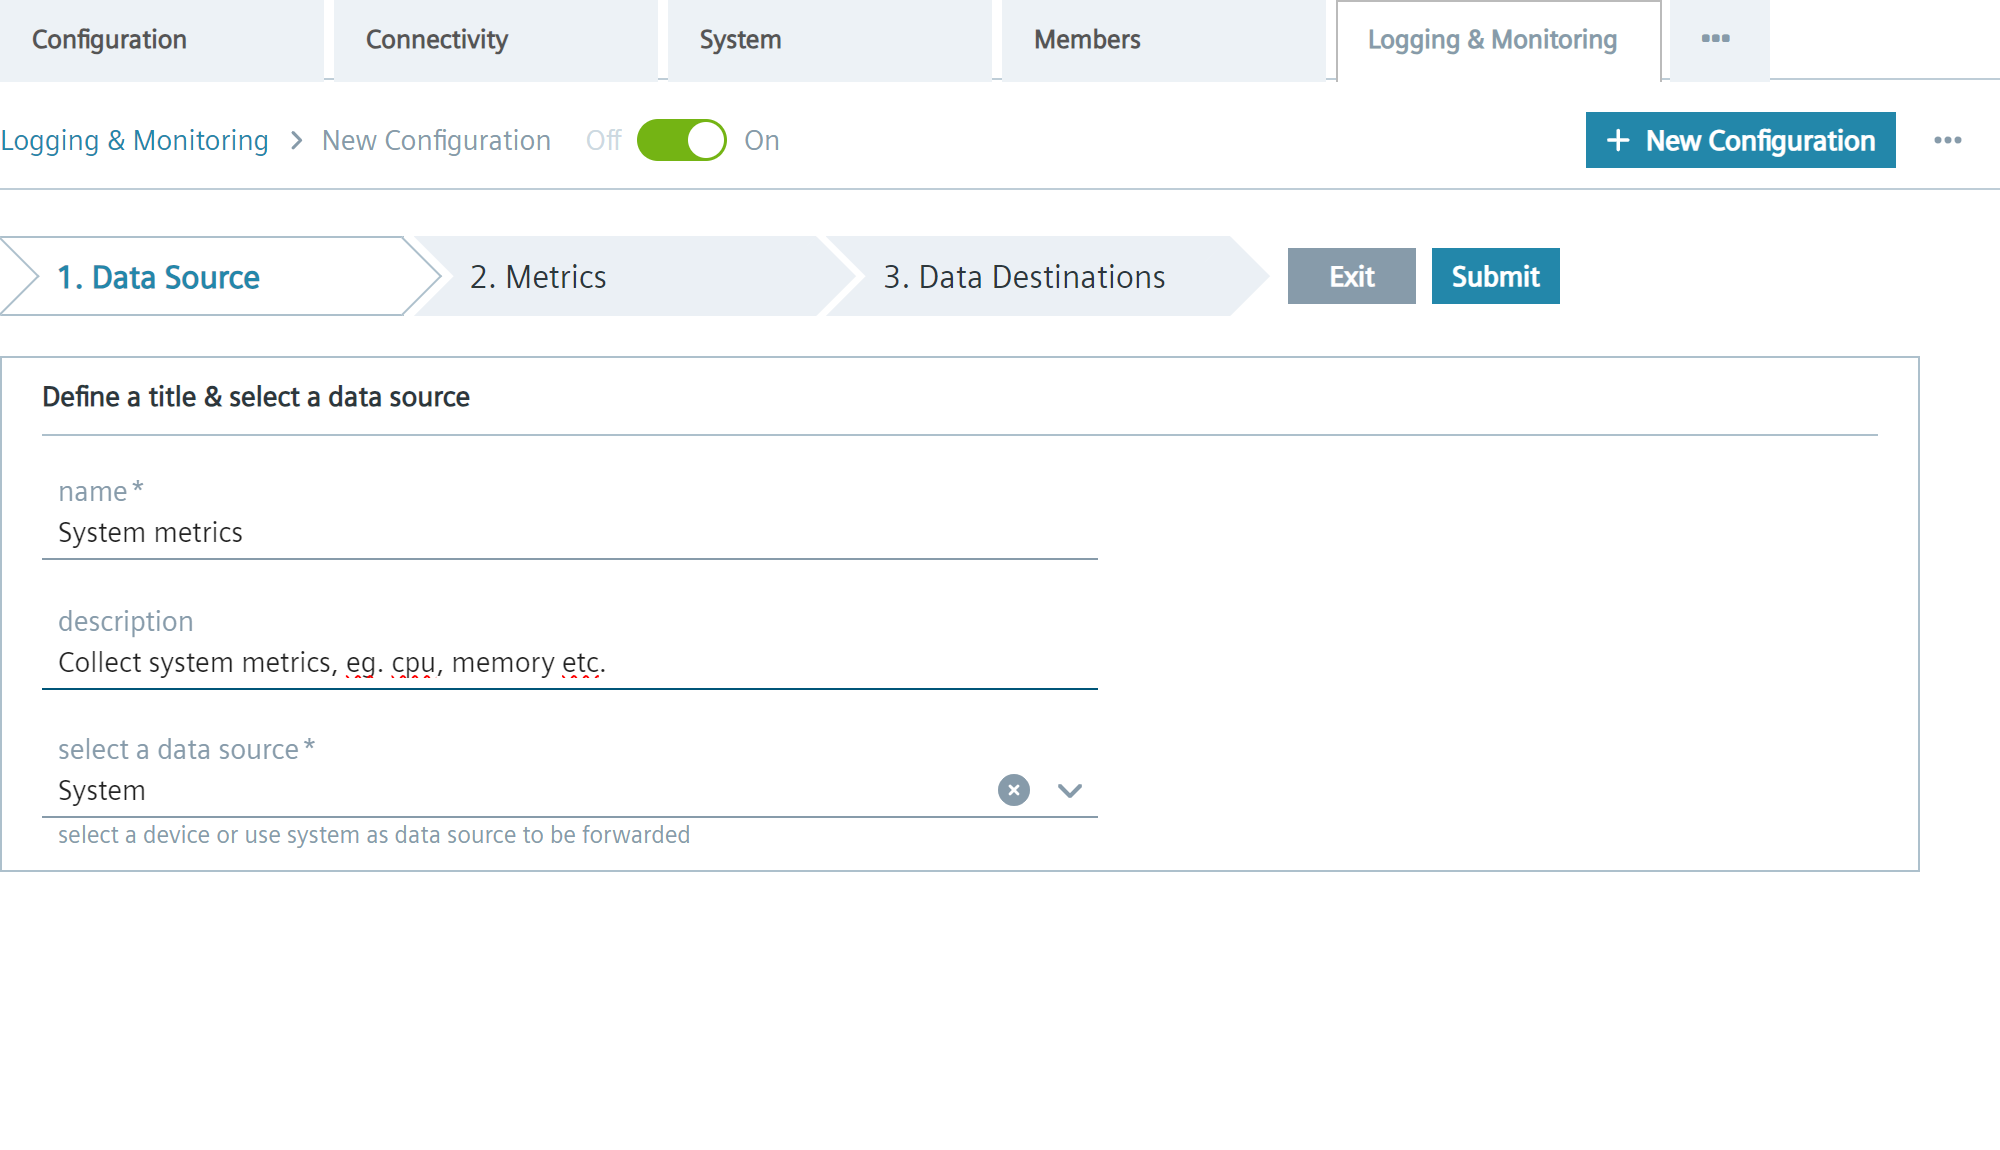
- In the
1. Data Sourcesection, fill in the required fields. For example
- Click
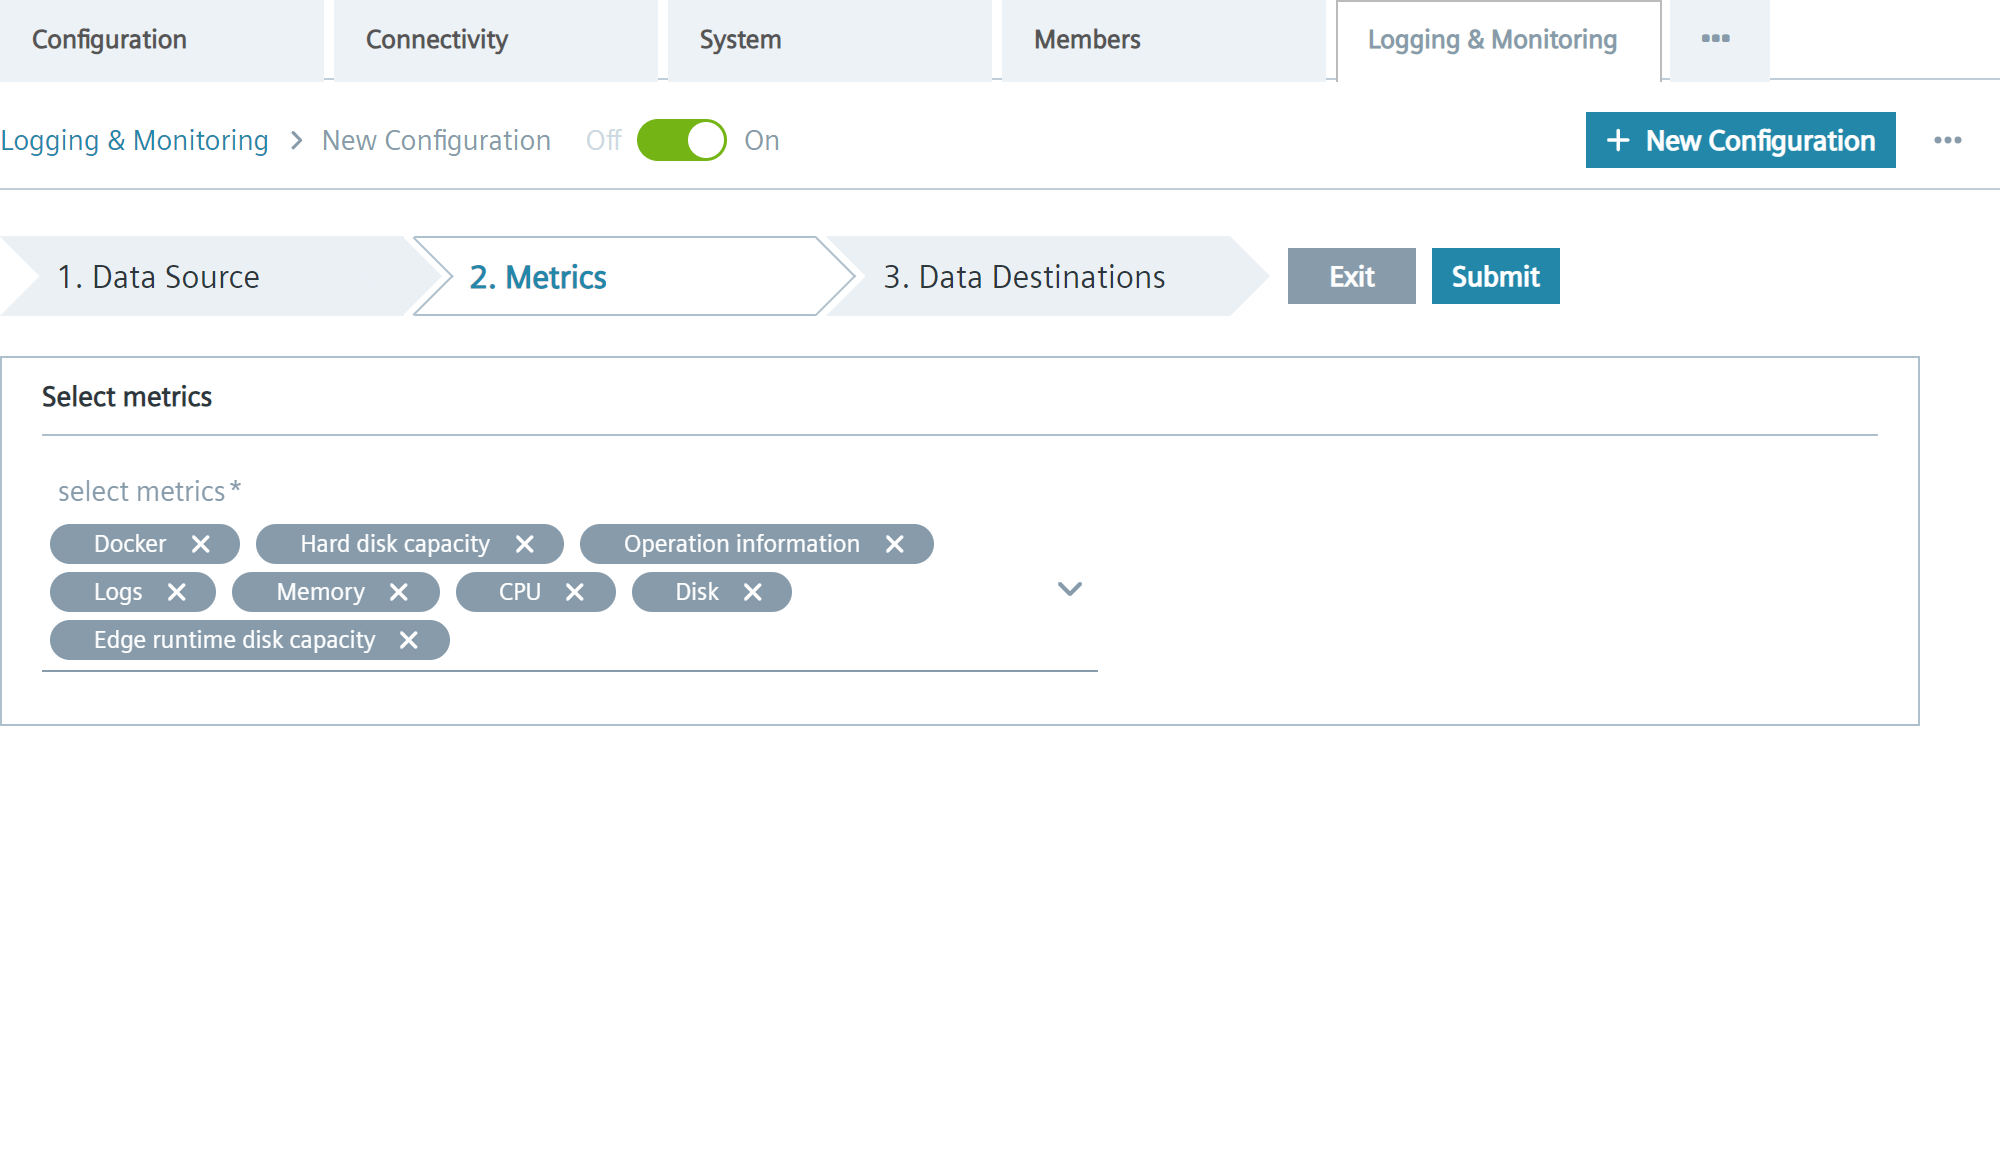
2. Metrics. - Click the
Select metricsfield to open drop-down list and select the metrics you want to collect. For more information about available metrics refer to Metrics Types.
- Click
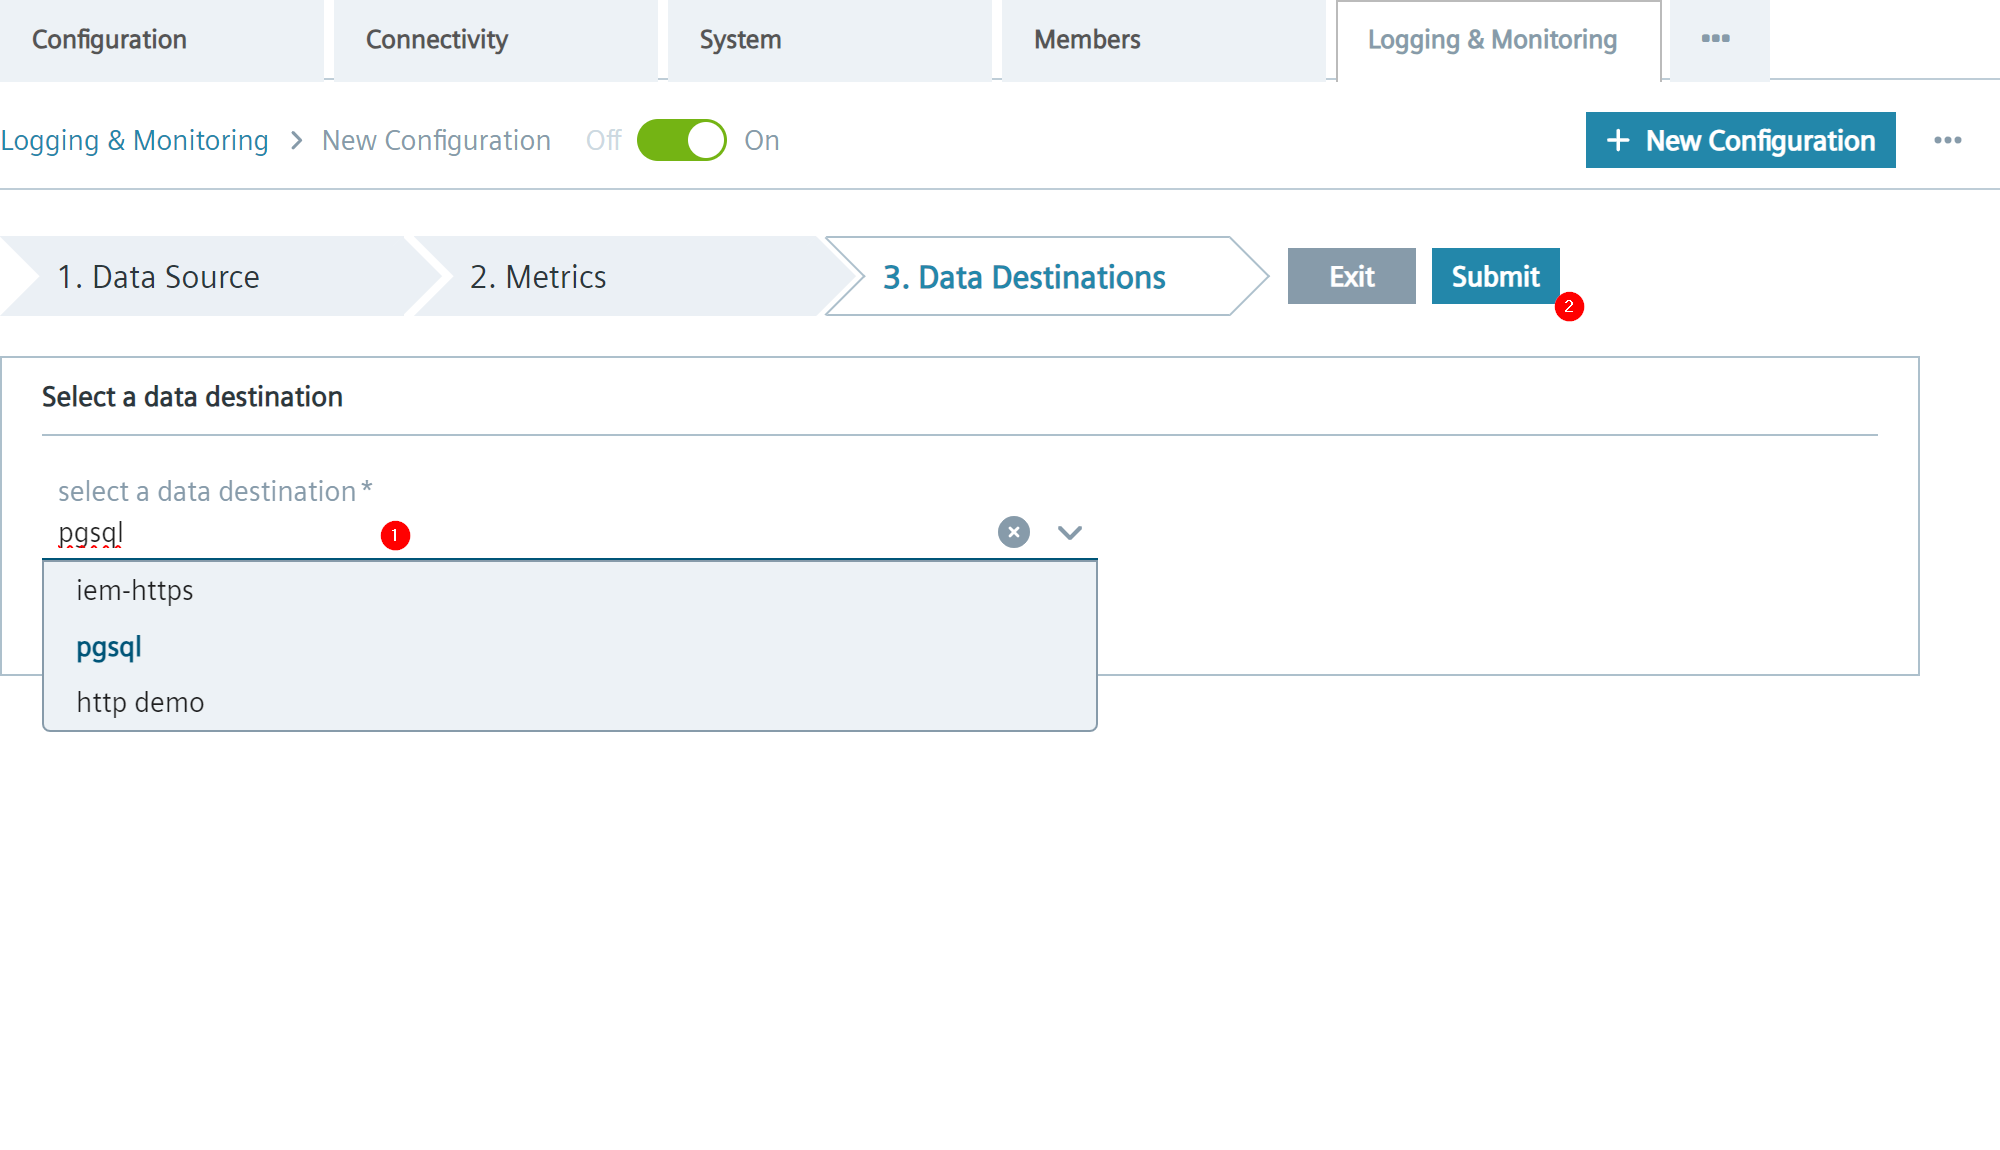
3. Data Destinations. - Click the
Select a destinationfield to open the drop-down list and select a destination.
To create new destination, refer to Creating destination. - Click the
Submitbutton.
After submitting, you will be automatically redirected to the configuration overview page. The newly created configuration is added to the configuration list.
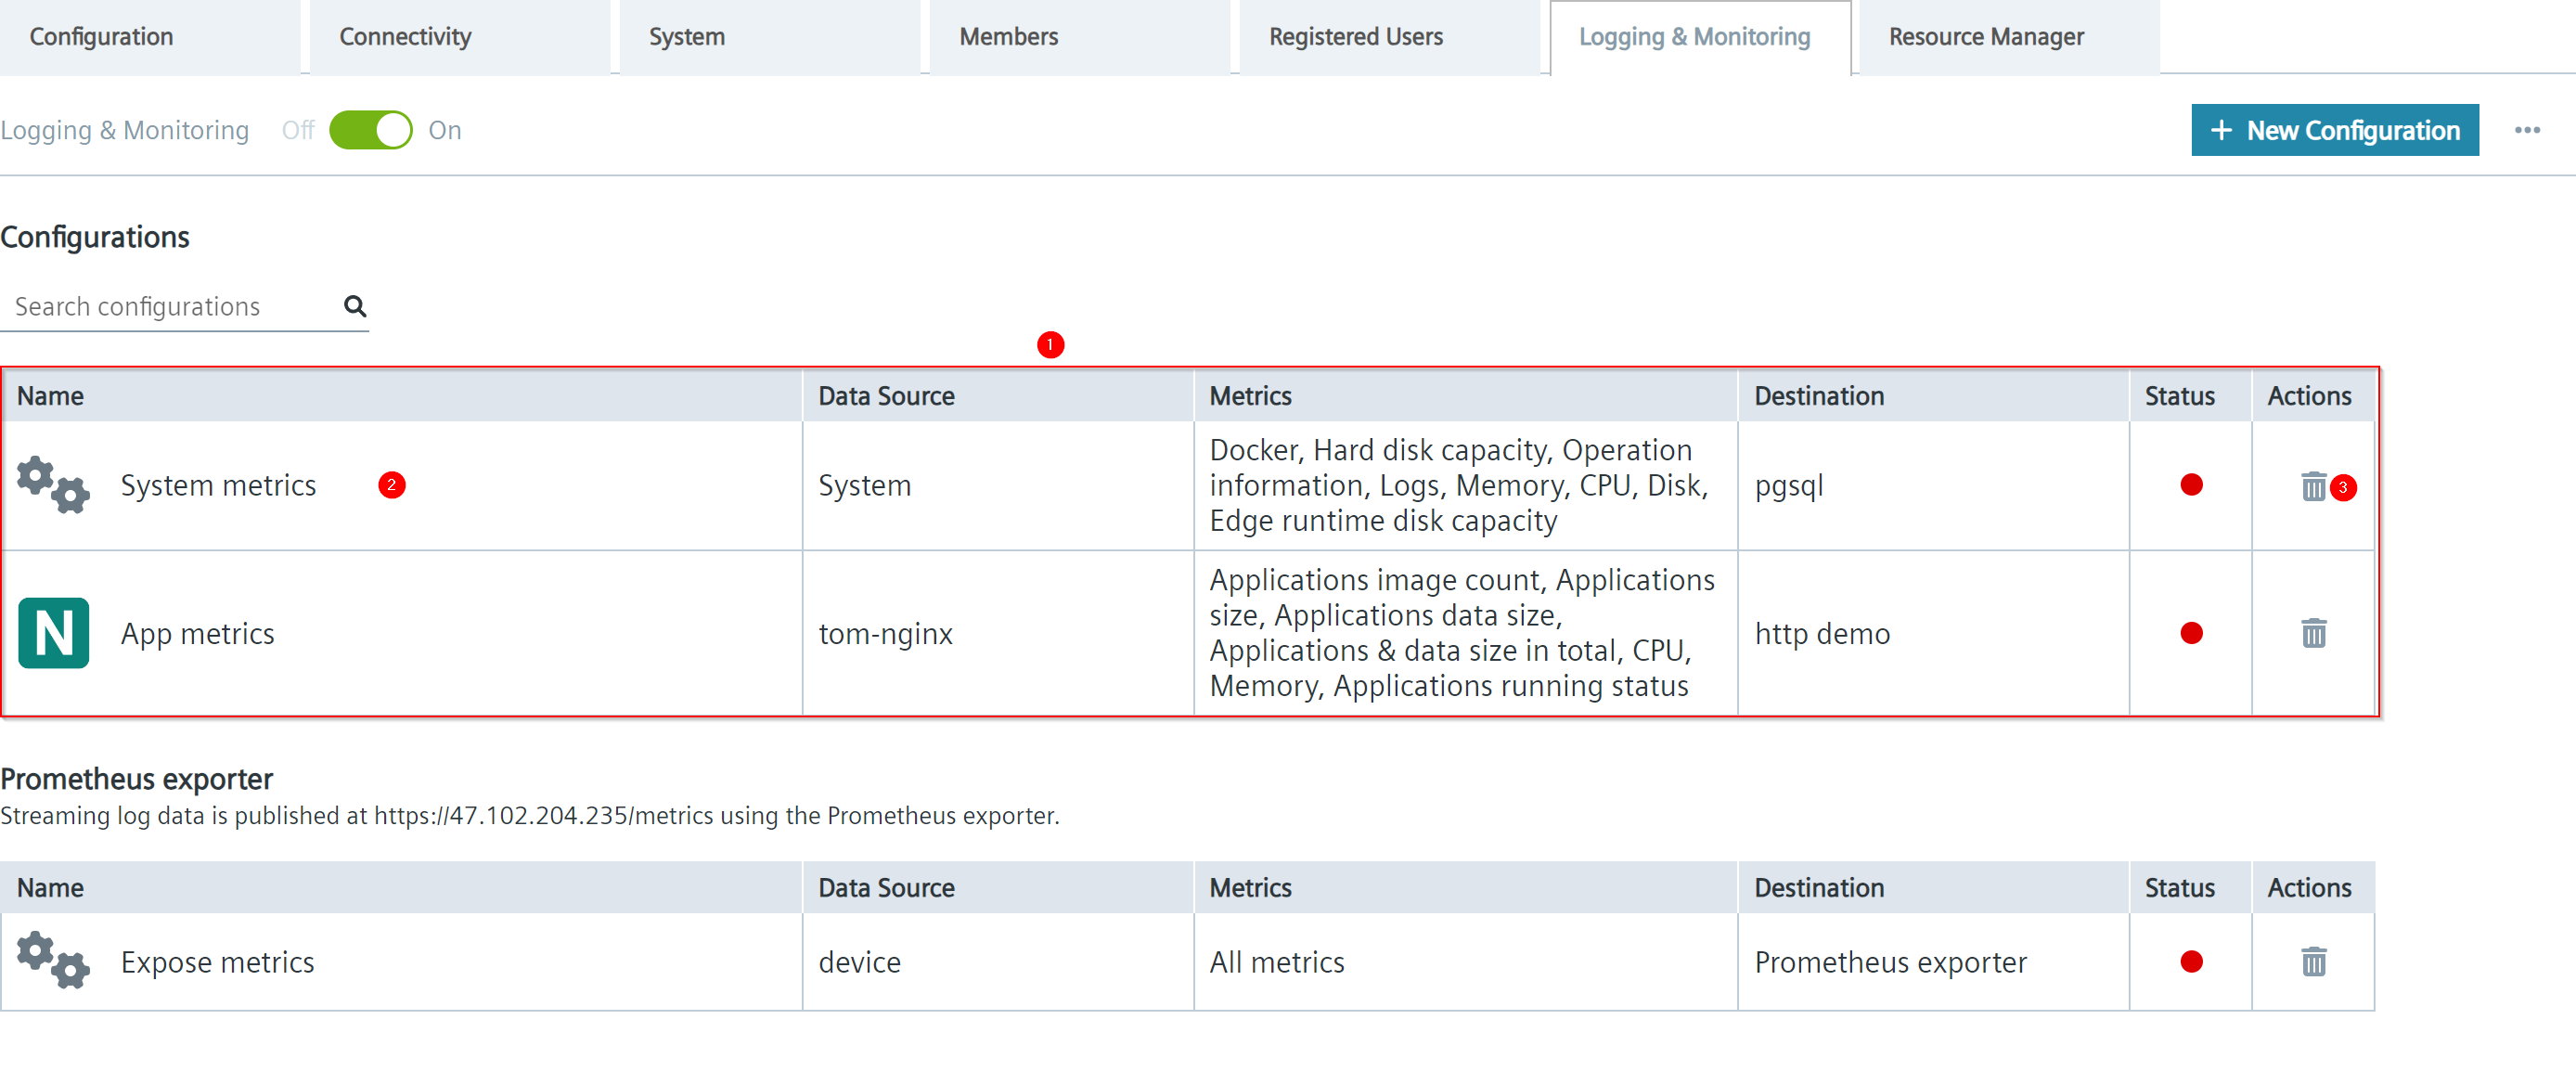
Users can click on the configuration item (2) to edit, or click on the trash bin icon (3) to remove it.
Data Source
Indicate where the metrics & log are collected from, which can be an application or a system.
Currently, each configuration can define only one data source. To collect data from multiple sources, users must create a separate configuration for each data source.
| Parameter | Description |
|---|---|
| Configuration title |
|
| Configuration description |
|
| Data source |
|
Metrics Types
Refer to the types of metrics & log data to collect.
The types of metrics data differ according to the type of data source.
| Data source | Parameter | Description |
|---|---|---|
| System | cpu | System CPU usage |
| disk | System disk io data | |
| mem | System memory usage | |
| operationinfo | IED system operation info | |
| diskcap | Disk capacity of host and usage | |
| edgediskcap | Disk (volumes) capacity usage in Edge core | |
| log | System log collected from journald | |
| Installed Edge Apps | imagesCount | App image count |
| appSize | App size | |
| dataSize | App data size | |
| totalSize | Total app size and app data size | |
| cpuUsage | CPU usage percentage | |
| status | App status: "0" for not running, "1" for running | |
| log | App container log |
NOTICE
If app providers want to use this mechanism to export app logs, the logs must use standard output (stdout).
Log Filtering using Log Levels
Application Logs get filtered by the Logging & Monitoring Service depending on the Log Level set in the Device Settings.
Due to the feature only application logs that implement logging the corresponding Log Level on each line can be transmitted.
For the standard device log level setting of info this means that only log lines which contain either Error, Warning or Info get transmitted.
NOTICE
To enable the transfer of application logs that don't implement proper Level logging set your Device Log level to trace.
Data Destination
Refer to where the metrics & log is forwarded to, such as InfluxDB, PostgreSQL etc.
Currently each configuration can define only one data destination. To route data to multiple destinations, users must create a separate configuration for each data destination.
For more detail about data destination, refer to Manage destinations.