Logging & Monitoring
NOTICE
Deprecation This feature is scheduled for deprecation in the upcoming release planned for September 2025. To mitigate any impact and ensure a smooth transition, please reach out to Siemens Support through a Support Request. Be sure to select "IEM Pro" as product and include "Deprecation of EdgeEye" in your subject or description.
The Logging & Monitoring service collects metrics and logs from connected edge devices for monitoring and analysis.
Fluent Bit version 3.1.9 is used. Fluent Bit is a fast, scalable logging & metrics processor and forwarder. Several Fluent Bit plugins are being used. More details about Fluent Bit plugins can be found in the plugins section section.
Web UI
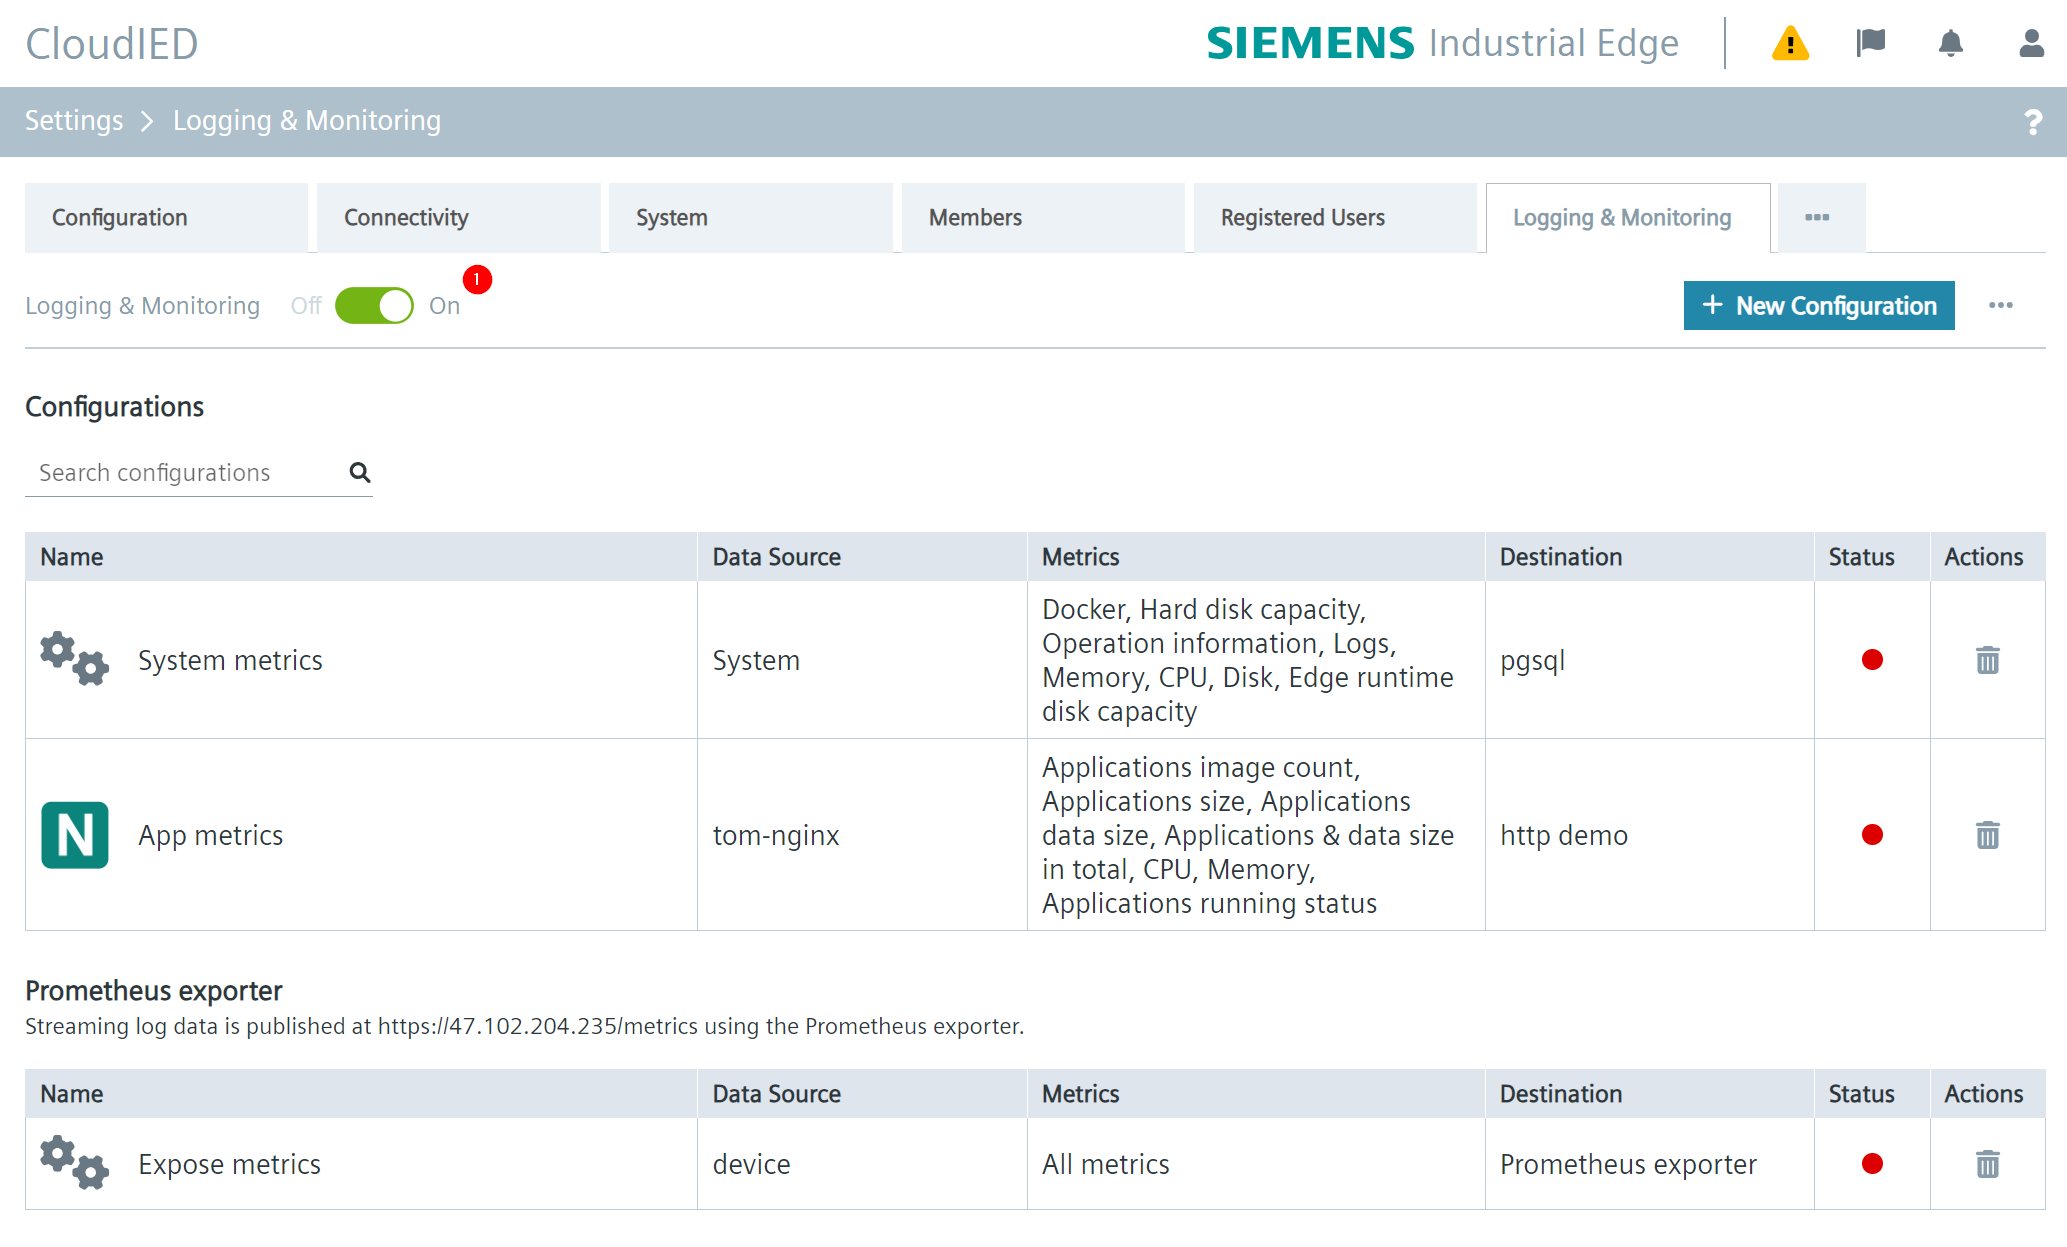
The Logging & Monitoring Service is available in the Edge Management Admin UI under Settings > Logging & Monitoring.
The Logging & Monitoring Service is displayed as below:
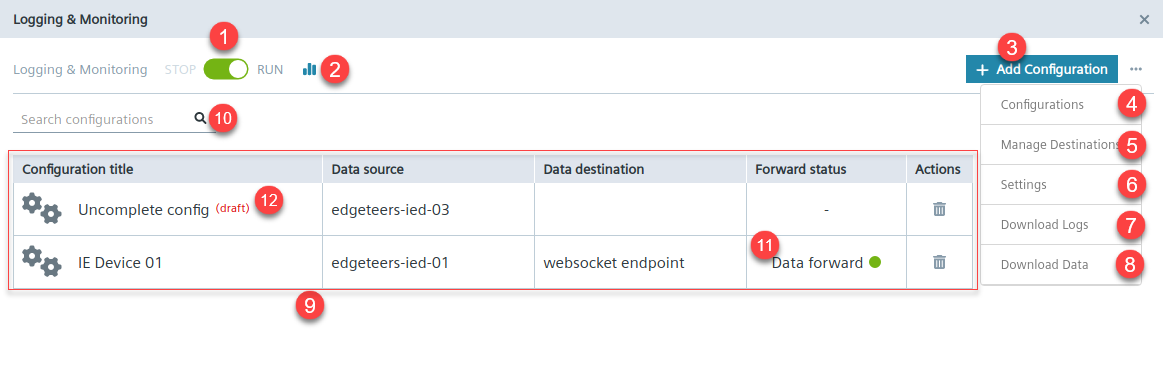
| No. | Description |
|---|---|
| ① | Service toggler |
| ② | Storage usage |
| ③ | Create configuration |
| ④ | Go to configuration list |
| ⑤ | Manage destinations |
| ⑥ | Logging & Monitoring Service settings |
| ⑦ | Download log files for a specified time range |
| ⑧ | Download metrics data for last 24 hour |
| ⑨ | Configuration list, including |
| ⑩ | Search for configuration |
| ⑪ | Destination health indicator: indicate connection status to destination. |
| ⑫ | Configuration state indicator |
Destination Connection Indicator
On the area ⑪, the status is used to indicate the health status of the target.
| Available state | Description |
|---|---|
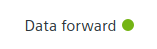 |
The connection to destination is healthy. |
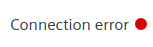 |
Connection to destination cannot be established. |
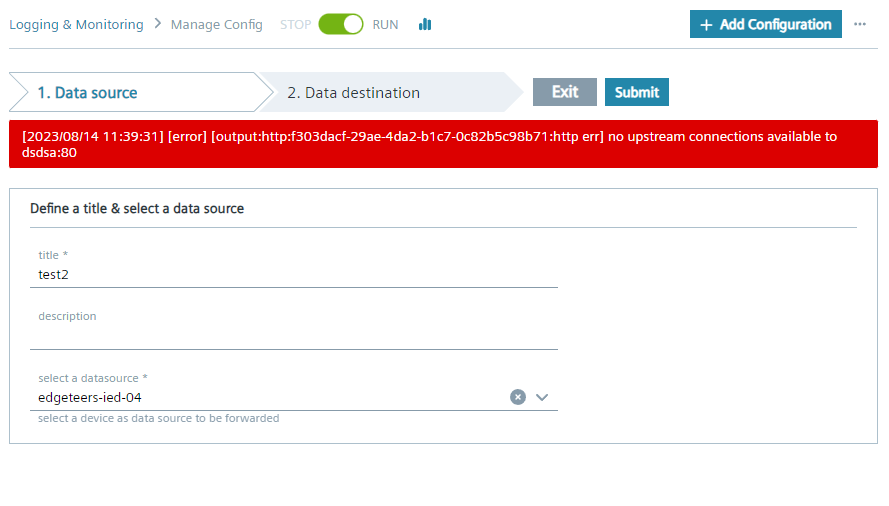
Hover over the connection error icon or go to the configuration detail page to see more details about the connection error if there is one.
On mouse hover you should see the following:
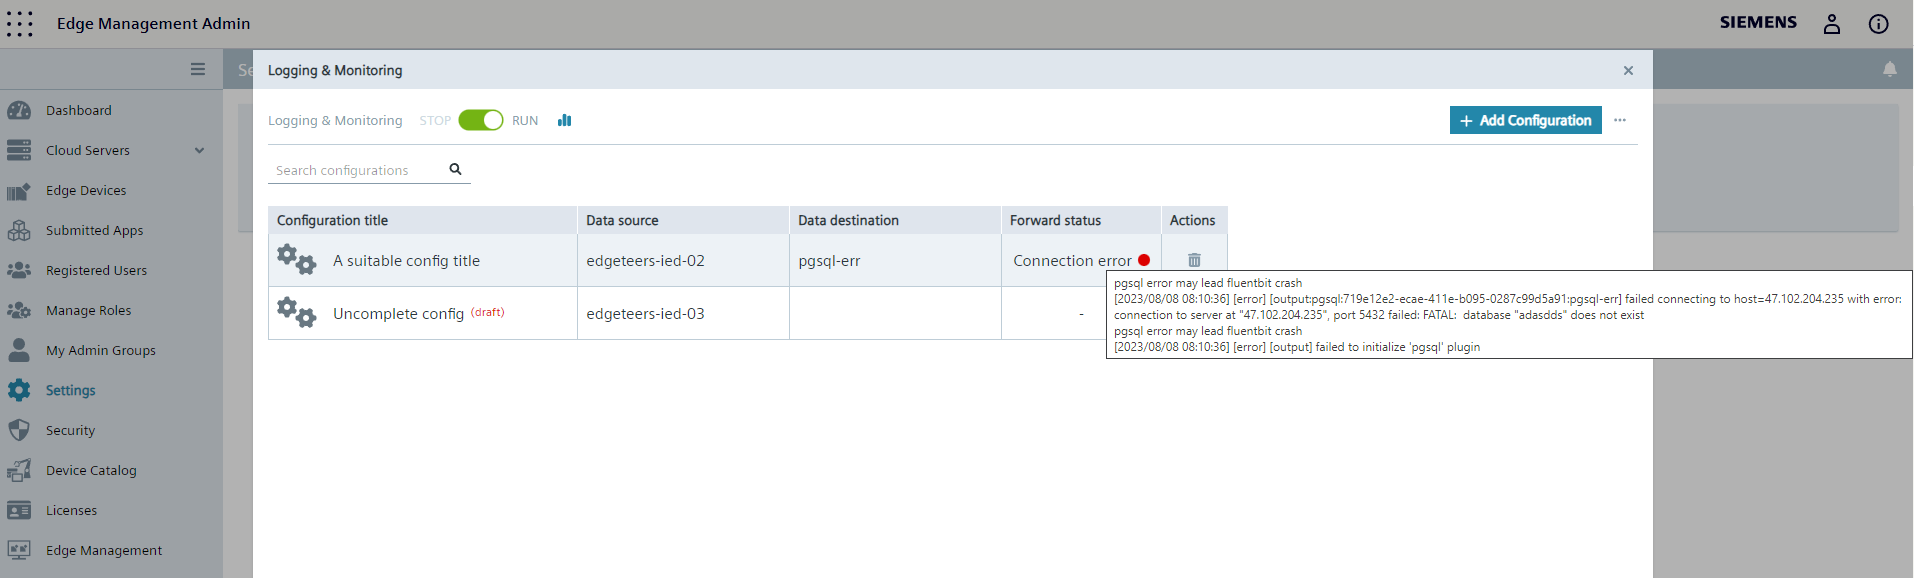
The configuration detail page is displayed as below:
NOTICE
The frequency of health check depends on value of 'Settings > flush'. For example,
Disable Logging & Monitoring service
The Logging & Monitoring Service is enabled by default. To disable it, click the service toggle at top left corner(①).
A pop-up window like the one below will appear:
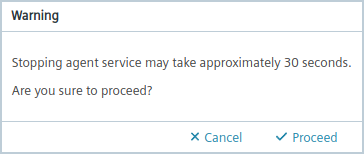
Click Proceed. After about 30 seconds, the service will stop.
To enable the Logging & Monitoring service, follow the same steps as above.
Storage Usage
The Logging & Monitoring service stores data in InfluxDB, to see the storage usage for InfluxDB, you can click ![]() on the top of Logging & Monitoring UI.
on the top of Logging & Monitoring UI.
Create Data Destination
Click Manage Destinations - ![]() to add a new data destination.
to add a new data destination.
When you create a new data destination, you first select a destination type and fill in all required fields. For more information about the required fields, see the Official Fluent Bit documentation - Outputs.
The following data destination types are available:
| Output Plugin | Description |
|---|---|
| WebSocket | Allows to flush your records into a WebSocket endpoint |
| TCP | Allows to send records to a remote TCP server |
| Syslog | Allows to deliver messages to Syslog servers |
| Standard Output (stdout) | Allows to print to the standard output of the received data |
| PostgreSQL (pgsql) | Allows to send data to a PostgreSQL database and to store data using the JSONB type |
| Null | Throws away events |
| Kafka | Allows to ingest your records into an Apache Kafka service |
| InfluxDB | Allows to flush your records into an InfluxDB time series database |
| HTTP | Allows to flush your records into an HTTP endpoint |
| Datadog | Allows to ingest your logs into Datadog |
| Amazon S3 | Allows to ingest your records into the AWS S3 cloud object store |
Check Destination Connectivity
Click ![]() to check whether the destination can be connected or not.
If the connection is successful, a success message like the one shown below is displayed.
Otherwise an error message will be displayed.
to check whether the destination can be connected or not.
If the connection is successful, a success message like the one shown below is displayed.
Otherwise an error message will be displayed.
![]()
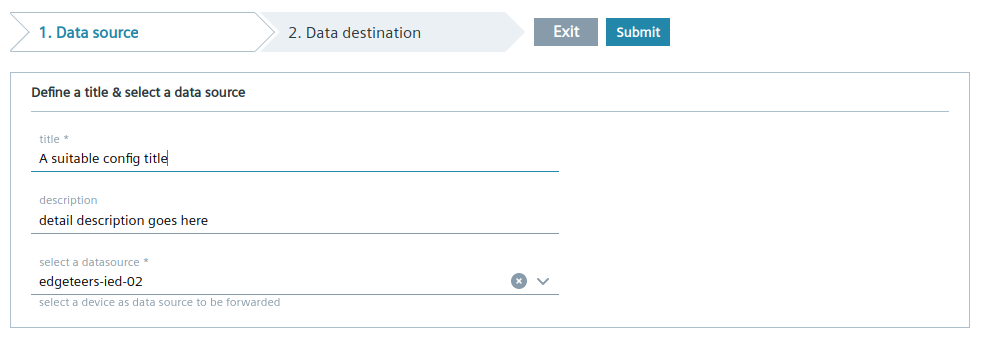
Create Configuration
Procedure
- Click
Add Configuration. The configuration wizard is displayed.
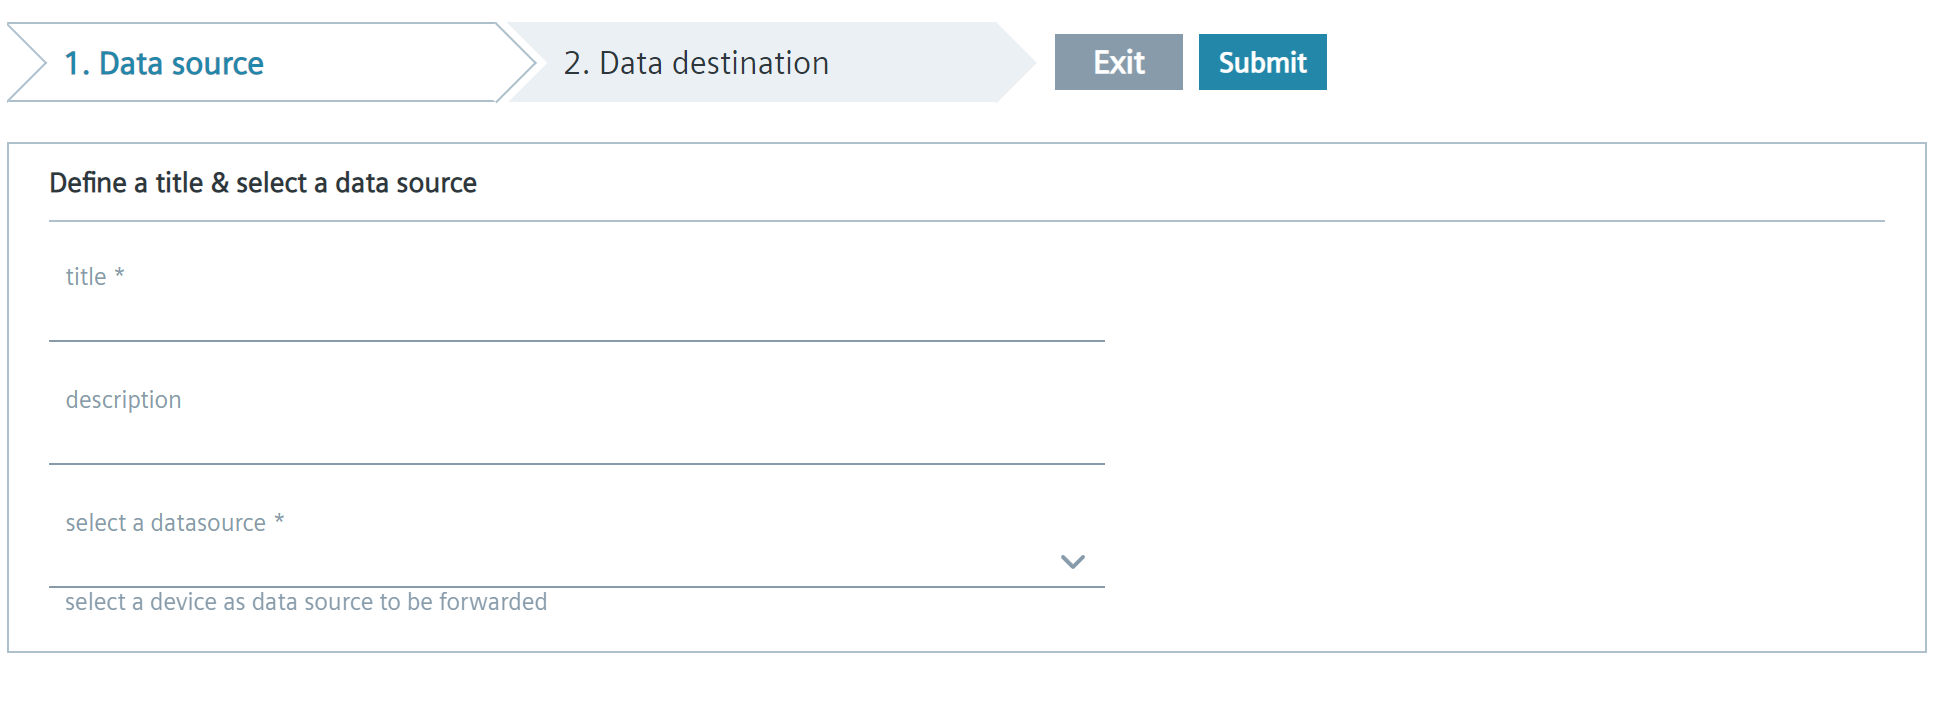
- In section of
Data source, fill up required fields, for example:
- Click
2. Data destination. -
Click
Select a data destinationfield to open the drop-down list, select a destination. In this example, 'websocket endpoint' is selected.NOTICE
Users need create a new destination (see
Creating data destinationabove) before creating the first configuration.
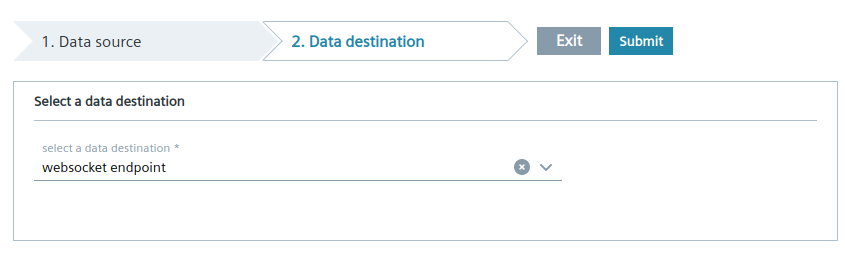
5. Click Submit.
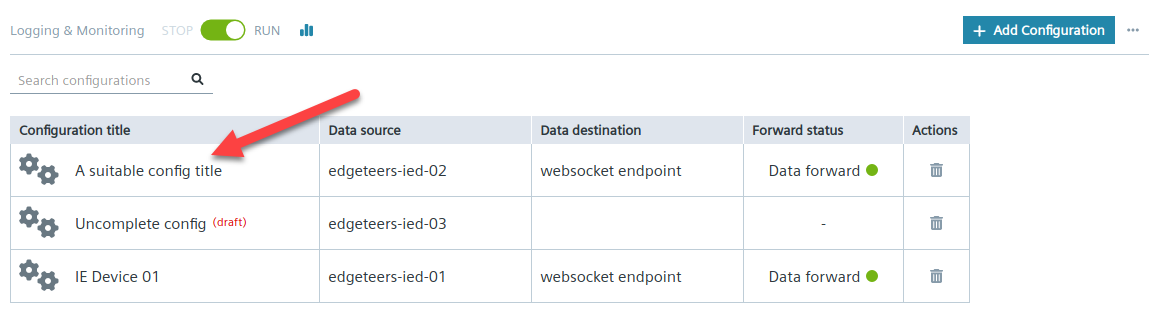
If all required information is provided, a success message is shown as below. The message differs depending on the value of configuration title.
![]()
The new configuration is added to the configuration list.
Data Source
Refer to where the metrics & log collected from, which can be a edge device or system.
Currently each configuration can define only one data source. To collect data from multiple sources, users need to create a separate configuration for each data source.
| Parameter | Description |
|---|---|
| Data source | • Refer to where the metrics & log comes from • Includes the names of onboarded IEDs |
| Configuration title | • Name of a configuration • Mandatory • Displayed in configuration list |
| Configuration description | • Additional information of a configuration • Optional |
Data Destination
Refer to where the metrics & log is forwarded to, such as InfluxDB, PostgreSQL etc.
Currently each configuration can only define one data destination. To forward data to multiple destinations, users need to create a separate configuration for each data destination.
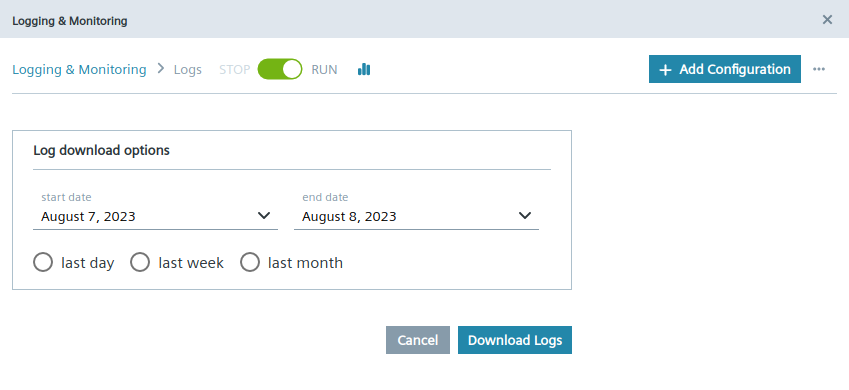
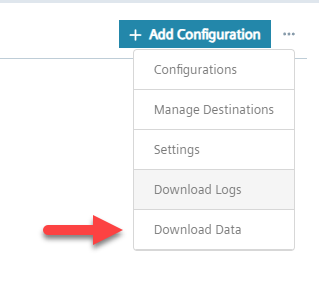
Download Logs
Users can click Download logs from the main screen to download log files within a specified time range.
Download Metrics Data
Users can also download recent metrics data collected from IE Devices.
To download the recent metrics data, click Download Data on the main screen.
Recent metrics data is downloaded and saved as an annotated csv format file. Annotated csv format is the output format of a Flux query with InfluxDB 2.1 and makes it easy for users to import metrics data into InfluxDB or other data analysis tools. For more information about annotated csv format file, see the Official InfluxDB 2.1 documentation.
Settings
| Tab | Parameter | Description |
|---|---|---|
| General | flush | • Set the flush time in seconds. The engine loop uses a flush timeout to define when it is required to flush the records received by input plugins through the defined output plugins. • Range: 1 ... 86400 sec. |
| Store time (days) for Device Data | • Set the retention period of device data. Logging & Monitoring service is saving data in InfluxDB for 7 days by default. • Range: 1 ... 30 days. |
|
| Store time (days) for IEM Data | • Set the retention period of IEM data. Logging & Monitoring service is saving data in InfluxDB for 7 days by default. • Range: 1 ... 30 days. |
|
| Log levels | Set the log levels for all log entries. | |
| Turn on Prometheus exporter | Turn on Prometheus exporter by setting checkbox checked, the service will export metrics data to the URL IEM-Address/edgeeye/prometheus/metrics for Prometheus server. |
|
| Prometheus authorization username | Set the Basic Auth's username for Prometheus server to pull metrics data. | |
| Prometheus authorization password | Set the Basic Auth's password for Prometheus server to pull metrics data. | |
| AWS access key/secret key | Aws access key | AWS Access Key |
| Aws secret key | AWS secret Key |
If you are using the AWS S3 plugin, AWS Access Key and AWS Secret Key must be set to connect to the AWS S3 plugin. AWS Access Key and AWS Secret Key are the credentials stored in the shared ~/.aws/credentials configuration file for connecting to AWS S3 services.
After entering the required parameters, click Save and apply to apply your global settings.
Export Device Metrics to Prometheus
- Go to
Settings-General - Check
Turn on Prometheus exporterto enable the ability that exports metris data to specific URL (by default, it isyour-IEMPro-Address/edgeeye/prometheus/metrics). - (Optional) Set
Prometheus authorization usernameandPrometheus authorization passwordto restrict users accessing the exporter URL. -
Configure Prometheus server to use pull mode to retrieve data from the exporter URL mentioned at step 2.
If
Prometheus authorization usernameandPrometheus authorization passwordare set, Prometheus server's configuration (normally located at/etc/prometheus/prometheus.yml) should be like below:
global:
scrape_interval: 5s
scrape_configs:
- job_name: iedevices-metrics
scheme: http
metrics_path: /edgeeye/prometheus/metrics
static_configs:
- targets: ["192.168.19.129"]
basic_auth:
username: test
password: 1234
Prometheus using HTTPS scheme
For security reason, users can set Prometheus to use https as scheme.
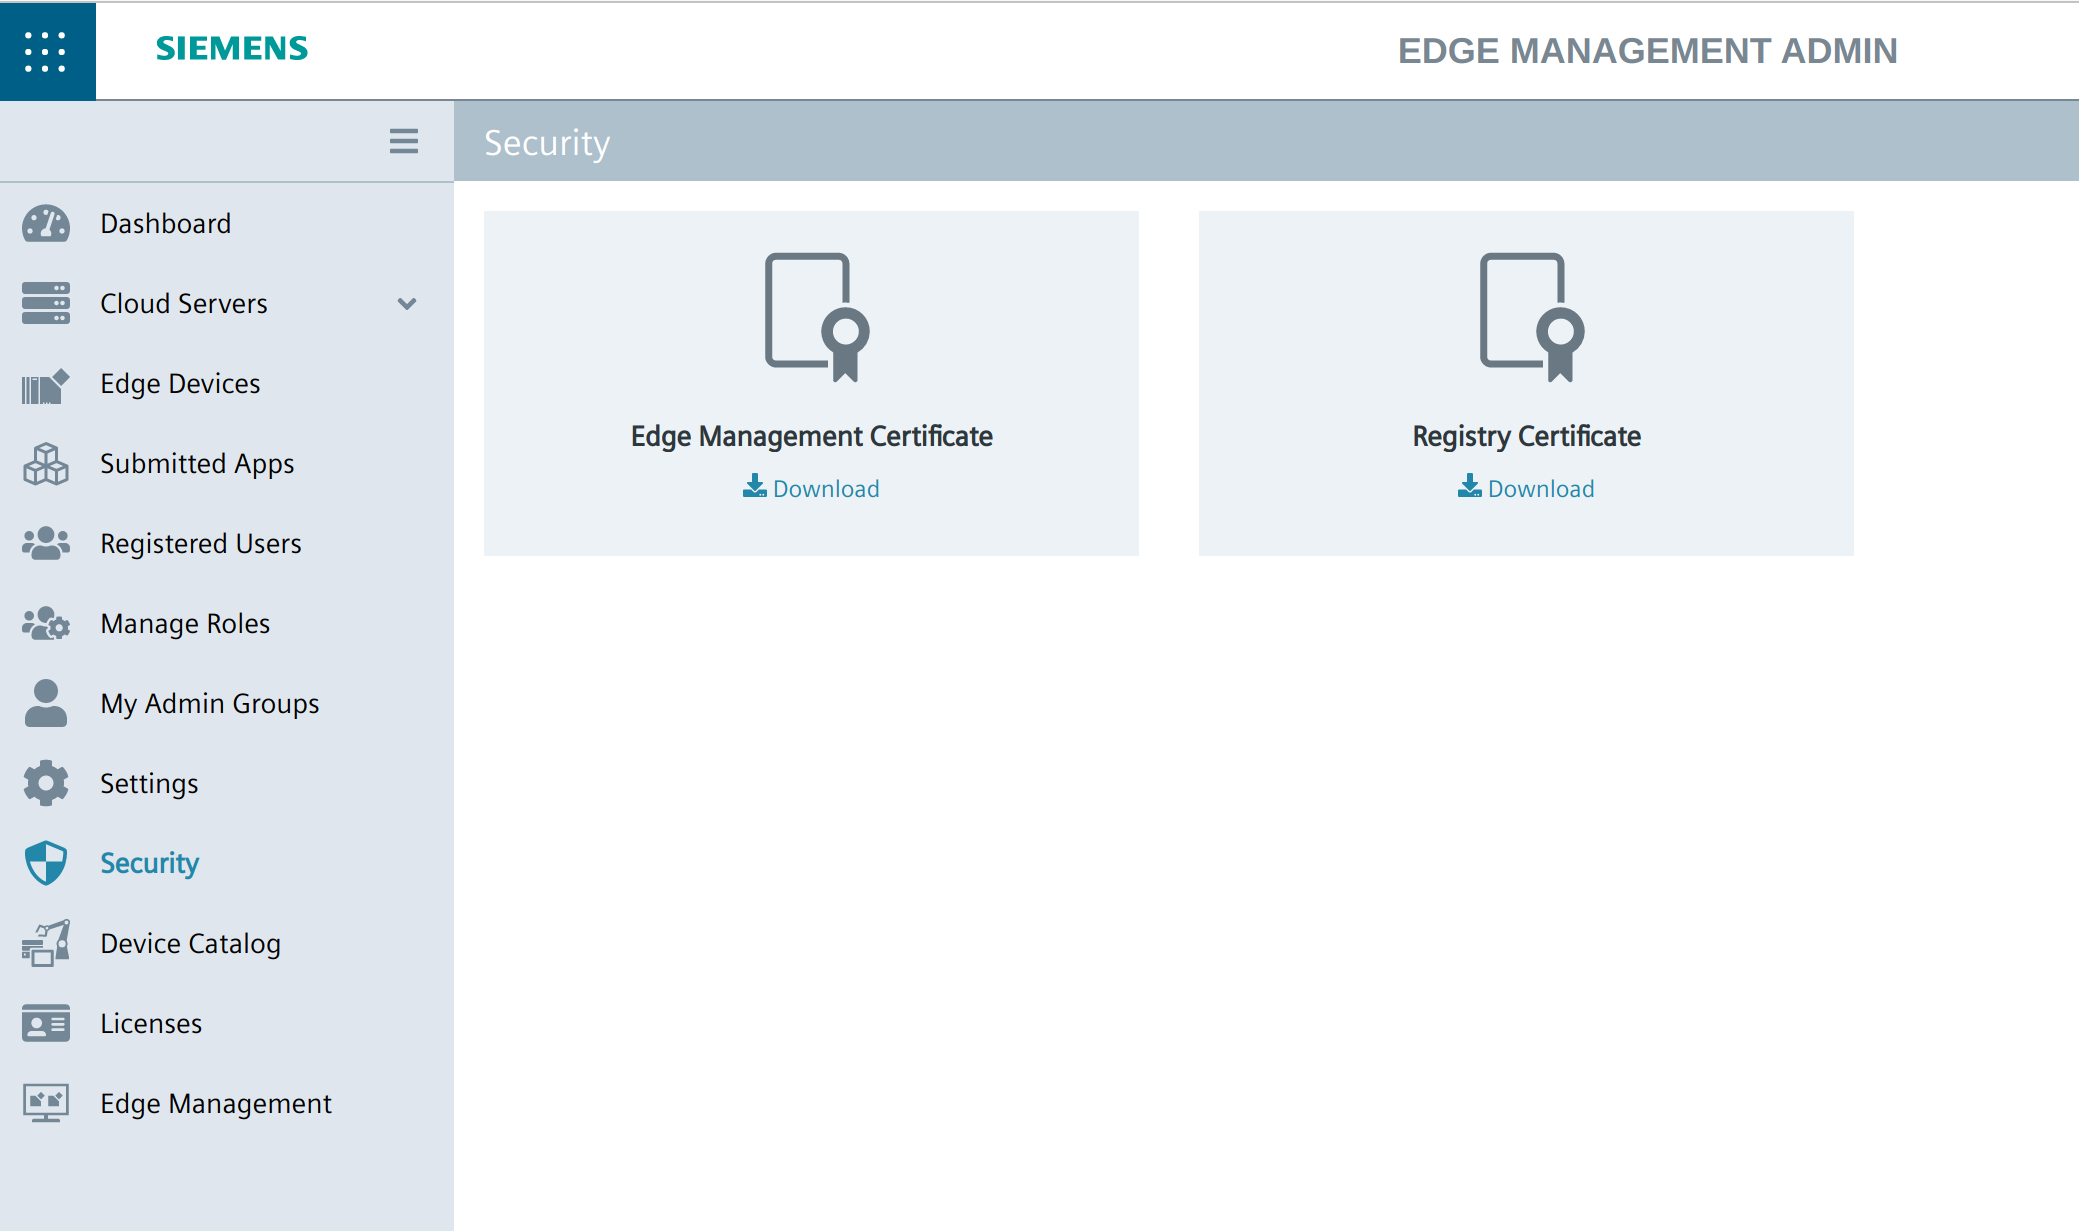
Go to Edge Management Admin - Security - Edge Management Certificate, Click the Download to download IEM's certificate file to local path.
At last, modify Prometheus server's configuration file as below:
global:
  scrape_interval: 5s

scrape_configs:
  - job_name: iem-exporter
    scheme: https
    metrics_path: /edgeeye/prometheus/metrics
    static_configs:
        - targets: ["192.168.19.129"]
    basic_auth:
        username: test
        password: 1234
    tls_config:
        ca_file: /your-local-path/edge-management-certificate.crt
Users can analyze metrics by Prometheus web UI, or a Grafana dashboard for data visualization. This Official Prometheus Documantation shows an example of how to use Grafana dashboard to retrieve Prometheus's data.
Following Prometheus metrics are available.
| Metrics name | Description | Labels |
|---|---|---|
| node_cpu_usage_percentage | The System CPU usage. | cpu: cpu core mode: value of "used", "free", "user", "system", "idle", "steal", "nice", "iowait", "irq", "softirq", "guestNice" |
| node_memory_info | The System memory usage | mode: value of "free", "used", "total", "swapFree", "swapUsed", "swapTotal", "freePercent", "usedPercent", "swapFreePercent", "swapUsedPercent" |
| node_disk_info | The System disk throughput. | mode: value of "ioTime", "readTime", "readBytes", "readCount", "writeTime", "weightedIO", "writeBytes", "writeCount", "iopsInProgress", "mergedReadCount", "mergedWriteCount" |
| node_docker_containers | The Docker containers info. | name: docker container name mode: value of "state", "memMax", "sizeRW", "memUsed", "cpuPercent", "memPercent", "sizeRootFs" |
| node_diskcap_info | The disk capacity of storage device. The unit is MB. | mode: value of "free", "used", "total", "freePercent", "usedPercent" |
| node_edgecore_diskcap_info | The disk (volumes) capacity usage in edge-core. The unit is MB. | path: absolute path mode: value of "free", "used", "total", "freePercent", "usedPercent" |
| node_edge_info | The edge-core runtime info. | mode: value of "runningApplicationCapicity", "runningApplicationAvailable", "installedApplicationCapacity", "installedApplicationAvailable” |
| node_app_images_count | The Edge APP images count. | appId: application ID name: application name repoName: application repository name |
| node_app_size | The Edge APP size. The unit is MB. | appId: application ID name: application name repoName: application repository name |
| node_app_data_size | The Edge APP data size. The unit is MB. | appId: application ID name: application name repoName: application repository name |
| node_app_total_size | The Edge APP total size. The unit is MB. | appId: application ID name: application name repoName: application repository name |
| node_app_cpu_usage | The Edge APP CPU usage. | appId: application ID name: application name repoName: application repository name |
| node_edge_appinfo | The Edge APP runtime info. | appId: application ID name: application name repoName: application repository name |
Labels available for all metrics - There are 3 labels on all Prometheus metrics:
- deviceId: device ID
- deviceName: device name
- ipAddr: device IP address
Limitations
Following are the limitations on the Logging & Monitoring Service
Data storage
To prevent issue with 'out of database storage', when user continuously generates configurations data, we implemented limitations at code level to mitigate risks:
• The maximum number of configured configurations is limited to 100. If exceeded, an error message (out of limit) is displayed.
PostgreSQL error breaks down Fluentbit service
NOTICE
PostgresSQL server's connnection error will break down fluentbit, which means no data can be forwarded.
And all configurations' forward status will become red as shown below.
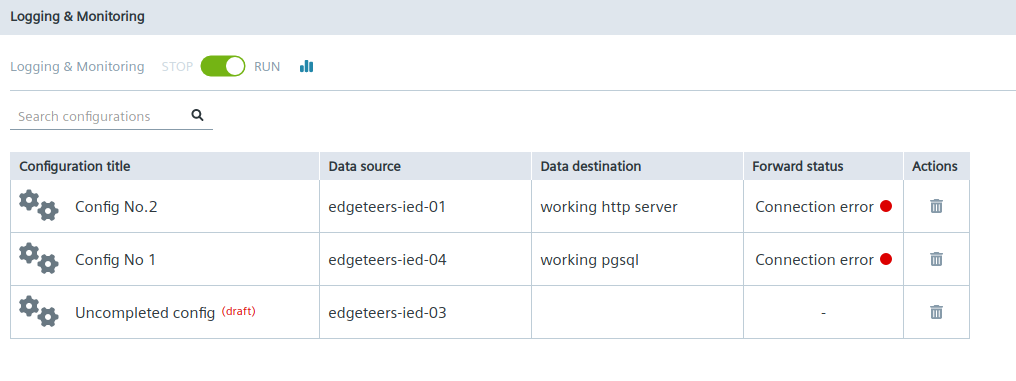
To fix this issue, either remove the PostgresSQL server as a data destination or fix connection problem of the PostgresSQL server.